Why do stocks fall after beating earnings?
 Allen Yan · · 6 min read
Contents
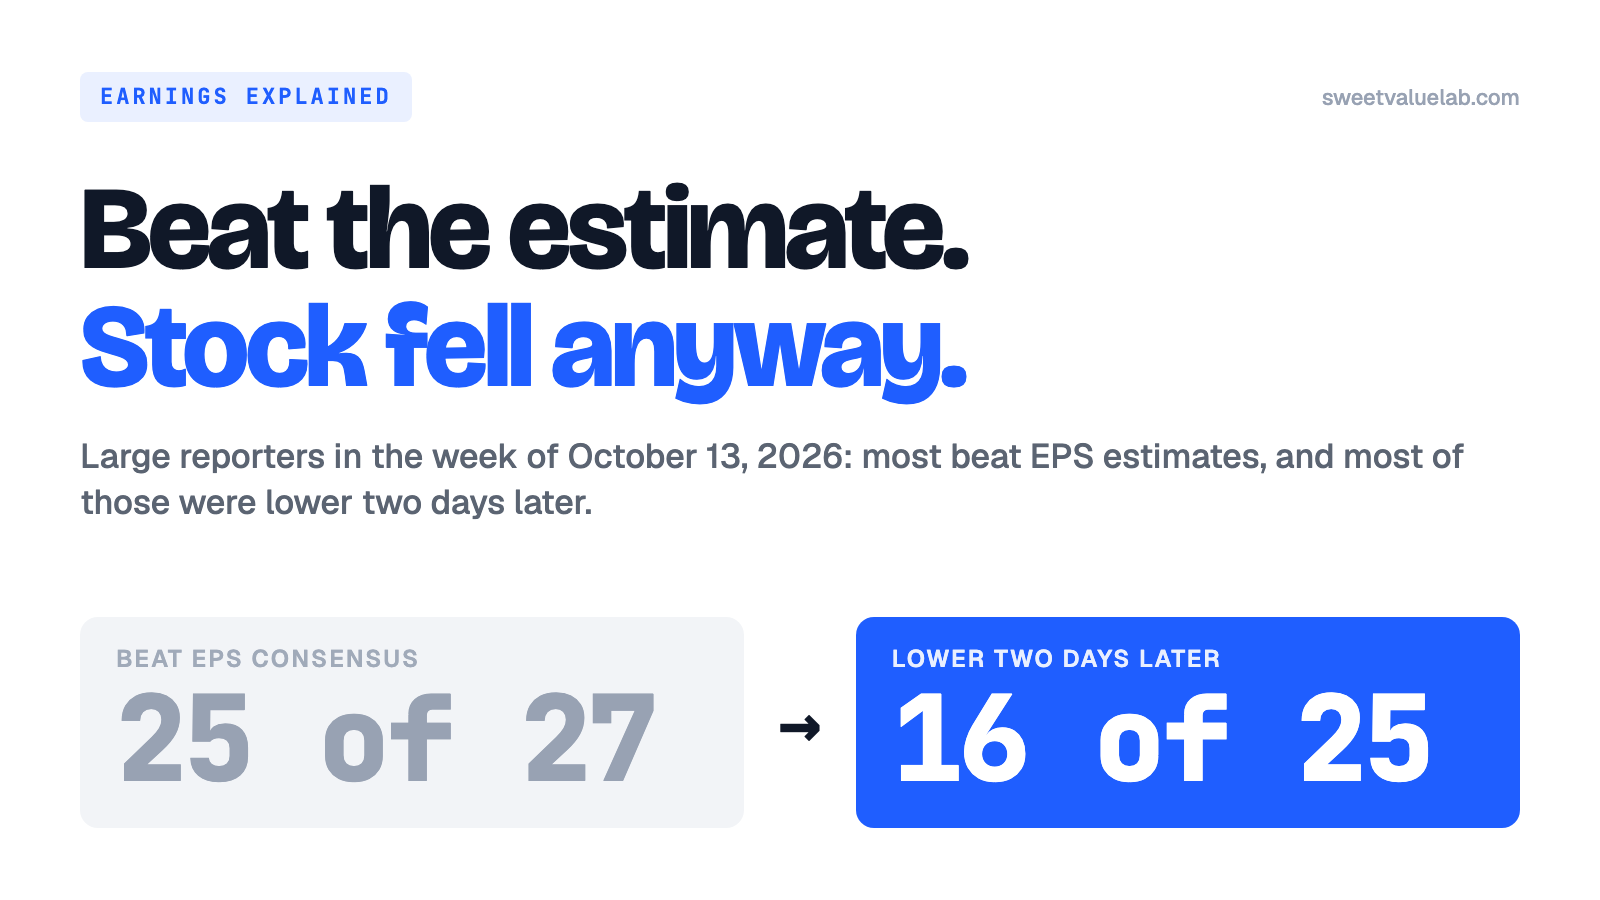
A company reports earnings per share above what analysts expected, and its stock falls the same day. It looks like a contradiction. It happens most quarters. In the week of October 13, 2026, 27 large companies on this site reported. Twenty-five beat the analysts' EPS estimate. Sixteen of those 25 were lower two days later.
The short answer is that a beat is one comparison: the reported number against one forecast. The price reacts to every other comparison investors make on the same day. This post goes through six of them, in the order a reader of an earnings release meets them, and shows each one on a real report from that week: Goldman Sachs, Citigroup, Johnson & Johnson and ASML. The four reports themselves are written up in a separate post.
Earnings consensus, the forecast a beat is measured against
The consensus is the average of the EPS estimates that analysts send to a data vendor before the report. LSEG, FactSet and FMP each collect their own panel, so there is no single consensus. For Goldman Sachs's third quarter, FMP's consensus was $12.86 and LSEG's was $13.02. Goldman reported $17.01, a beat of 32% on one count and 31% on the other.
The forecast is public for weeks, and companies talk to analysts about it, so most companies beat it. Aswath Damodaran makes this point with the second quarter of 2026 in a post on the earnings game: positive surprises far outnumbered negative ones, and many of them came with price drops. October 13's week looked the same.
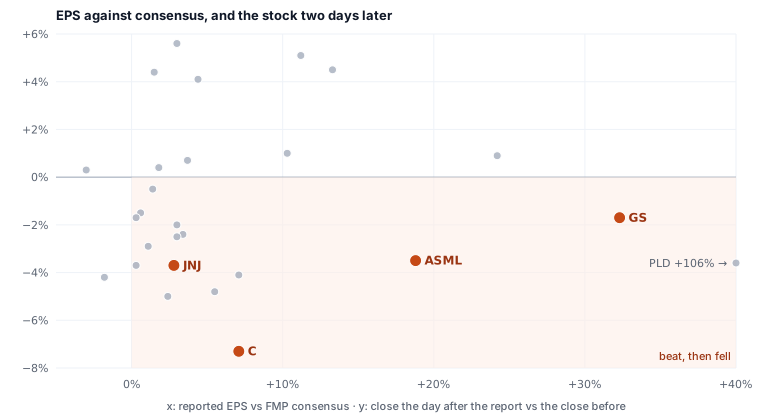
The chart has no slope to speak of. A 32% beat (Goldman) fell 1.7% over two days; an 11% beat (BlackRock) rose 5.1%. When nearly every company beats, the fact of a beat carries little information. The rest of the release carries more.
Sequential comparison, last quarter as the second baseline
Earnings releases lead with year-over-year growth: this quarter against the same quarter a year earlier, which removes seasonal swings. Investors also compare the quarter with the one just before it. That comparison is sequential, or quarter over quarter.
The two can point in opposite directions when the previous quarter was unusually strong. Goldman's third-quarter EPS was up 39% from a year earlier and down 19% from the second quarter, which had been $20.98 (earnings release). Fixed-income trading revenue was flat from a year earlier and down 24% from the quarter before.
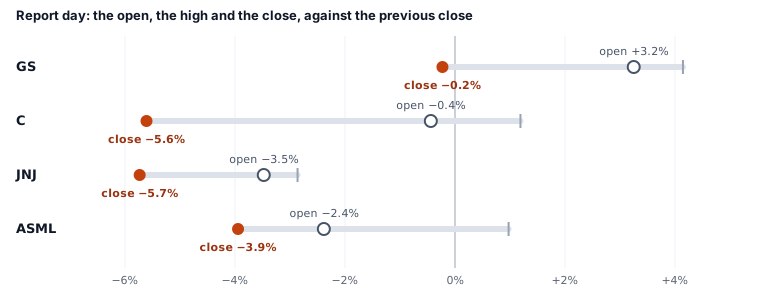
Goldman's shares opened 3.2% higher on the morning of the report, with the headline beat. They closed 0.2% lower, after a day in which the sequential numbers and the call had been read.
Guidance, the forecast for the next quarter
A share price is a claim on all future earnings, and the quarter just reported is only one of them. So what management says about the next quarter can matter more than the quarter itself. That forward statement is guidance. It comes in the release or on the call.
Citigroup reported its best third-quarter revenue in a decade, and EPS of $2.85 against $2.66 expected (release). On the call, its chief financial officer said fourth-quarter Markets revenue would be down about 20% from the third, "possibly a bit more" (transcript). On $6.11 billion of third-quarter Markets revenue, that is about $1.2 billion less in the next quarter. The stock closed the day 5.6% lower.
A lowered bar, when the forecast was cut before the report
A consensus follows the company's own guidance. When a company cuts its guidance between reports, analysts cut their estimates, and the next quarter is measured against the lower number. A beat then shows only that the cut was deep enough. It says little about the business.
On July 15, 2026, Johnson & Johnson guided full-year adjusted EPS to $11.60–$11.75. On July 29 it cut that by $0.64, to $10.96–$11.11, for the cost of two acquisitions (8-K). Third-quarter adjusted EPS came in at $2.59, above the $2.52 consensus and 7.5% below the $2.80 of a year earlier (release). Analysts also forecast segments, and MedTech's $8.64 billion was under LSEG's $8.71 billion for a second quarter in a row (Reuters via CNBC). The stock fell 5.7% on the day.
One-off items, earnings that will not repeat
EPS includes everything that passed through the income statement in the quarter, including gains and charges that will not happen again. A valuation is built on the earnings that recur, so readers take the one-off items out before they compare.
ASML reported EPS of €12.93. The quarter included a €509.7 million pre-tax gain on equity investments, which its CFO tied mostly to revaluing a stake in Mistral AI (release, call). Over about 384 million shares, that is €1.33 a share before tax. Sales, which carry no such items, came in at €11.66 billion against about €11.72 billion expected. The ADR fell 3.9% on the day.
Goldman had one too, smaller and spread over the year: a tax benefit on share-based awards added about $3.20 to EPS over the first nine months of 2026, according to its release.
Expectations already in the price
Before the release, the price already holds the market's view of what the release will say. A stock that rose into its report has paid for part of the beat in advance. A stock that fell into it has priced some of the bad news.
Citigroup rose 3.1% on October 12, the day before its report, to $131.93, its highest close of the month. Two days later it was at $122.27. The same idea, run across a whole valuation, is a reverse DCF: it asks what growth the current price already assumes. How to read a reverse DCF walks through one.
The whole market, when everything moves on the same day
A company's report day is also the market's day. On October 14, September's consumer prices came in at 3.7% a year against 3.6% expected (XTB). That was ASML's report day; Nvidia closed down 3.16% and Micron 4.10% (TradingKey). Some of ASML's fall belonged to the sector. A stock's move is easier to read next to its peers' moves on the same day.
A checklist for the next beat
| Comparison | The question | Where to look | This quarter's example |
|---|---|---|---|
| Consensus | Beat by how much, against whose estimate? | The release and a data vendor | GS $17.01 vs $12.86 (FMP), $13.02 (LSEG) |
| Last quarter | Up or down from the quarter before? | The release's quarterly tables | GS EPS −19% Q/Q |
| Guidance | What does management expect next? | The call transcript | C: Q4 Markets ~−20% |
| Earlier cuts | Was the estimate lowered before the report? | 8-Ks filed between reports | JNJ: −$0.64 on July 29 |
| One-off items | How much of the EPS will not repeat? | The release's notes | ASML: ~€1.33 a share from one gain |
| The price before | Did the stock run up into the report? | The price chart | C: +3.1% the day before |
| The market that day | Did peers move the same way? | Peers' moves that day | Oct 14: NVDA −3.16%, MU −4.10% |
The reports due next are on the earnings calendar. Each company's valuation, against this site's models, is on its stock page: Goldman Sachs, Citigroup, Johnson & Johnson, ASML.
Sources and data
- Goldman Sachs, Q3 2026 earnings release, 2026-10-13.
- Citigroup, Q3 2026 earnings release, 2026-10-13; call transcript (Investing.com), 2026-10-13.
- Johnson & Johnson, Q3 2026 earnings release, 2026-10-13; guidance 8-K, 2026-07-29; Reuters via CNBC, 2026-10-13.
- ASML, Q3 2026 press release, 2026-10-14; call transcript, 2026-10-14; TradingKey, 2026-10-14.
- Aswath Damodaran, Information Timing and Release Gaming, 2026-07.
- XTB on the September CPI, 2026-10-14.
- Consensus EPS: FMP's earnings calendar, read 2026-10-19. Prices: daily closes on this site's stock pages, through 2026-10-16.
The weekly
The week's 13F filings, insider trades and earnings, plus new research on the site. One email a week, no account.
More posts
- Alphabet Q3 2026: Cloud +103%, free cash flow −$9.1B
- GE Vernova Q3 2026: $29B of orders, paid for in advance
- SoFi Q3 2026: revenue +44%, a $0.90 EPS outlook for 2027
- Coca-Cola Q3 2026: volume +5%, EPS guidance raised to 11%
- Anthropic's S-1: a $974 million operating profit in Q2 2026
- Tesla–SpaceX merger: the exchange ratio, valued part by part
- SpaceX Q3 2026: revenue +161%, the valuation moves $2
- Why Goldman, Citi, J&J and ASML stocks fell after earnings
- Anthropic's $16.8B quarter: the investor day numbers
- What is a DCF? What a corner shop is worth
- How the 10-year Treasury moves every valuation on this site
- Delta vs United by the numbers
- Anthropic's IPO prospectus: the numbers behind the $42B loss
- Who actually owns this stock: how to read a 13F
- How to read a market sentiment gauge
- Market breadth: the index can rise while most stocks fall
- How we value a stock: twelve models, one number
- Where the numbers come from: filings, point in time
- Tesla, taken apart: a sum of the parts in three scenarios
- How to read a reverse DCF: the growth a stock price implies
- How to value a bank: P/TBV, ROTCE and the line
- How to value a REIT: FFO, P/FFO and the yield spread
- How to value a software company: Rule of 40 and SBC
- Total return vs price return: what a stock chart leaves out
- What a backtest cannot tell you