Who actually owns this stock: how to read a 13F
 Allen Yan · · 9 min read
Contents
Four times a year, every large investment manager in the United States has to hand the SEC a list of the US stocks it holds, and anyone can read it for free. The form is called a 13F. It is also the most misread document in public markets, for a reason printed on its own first page: by the time you can read it, it describes a day six weeks in the past.
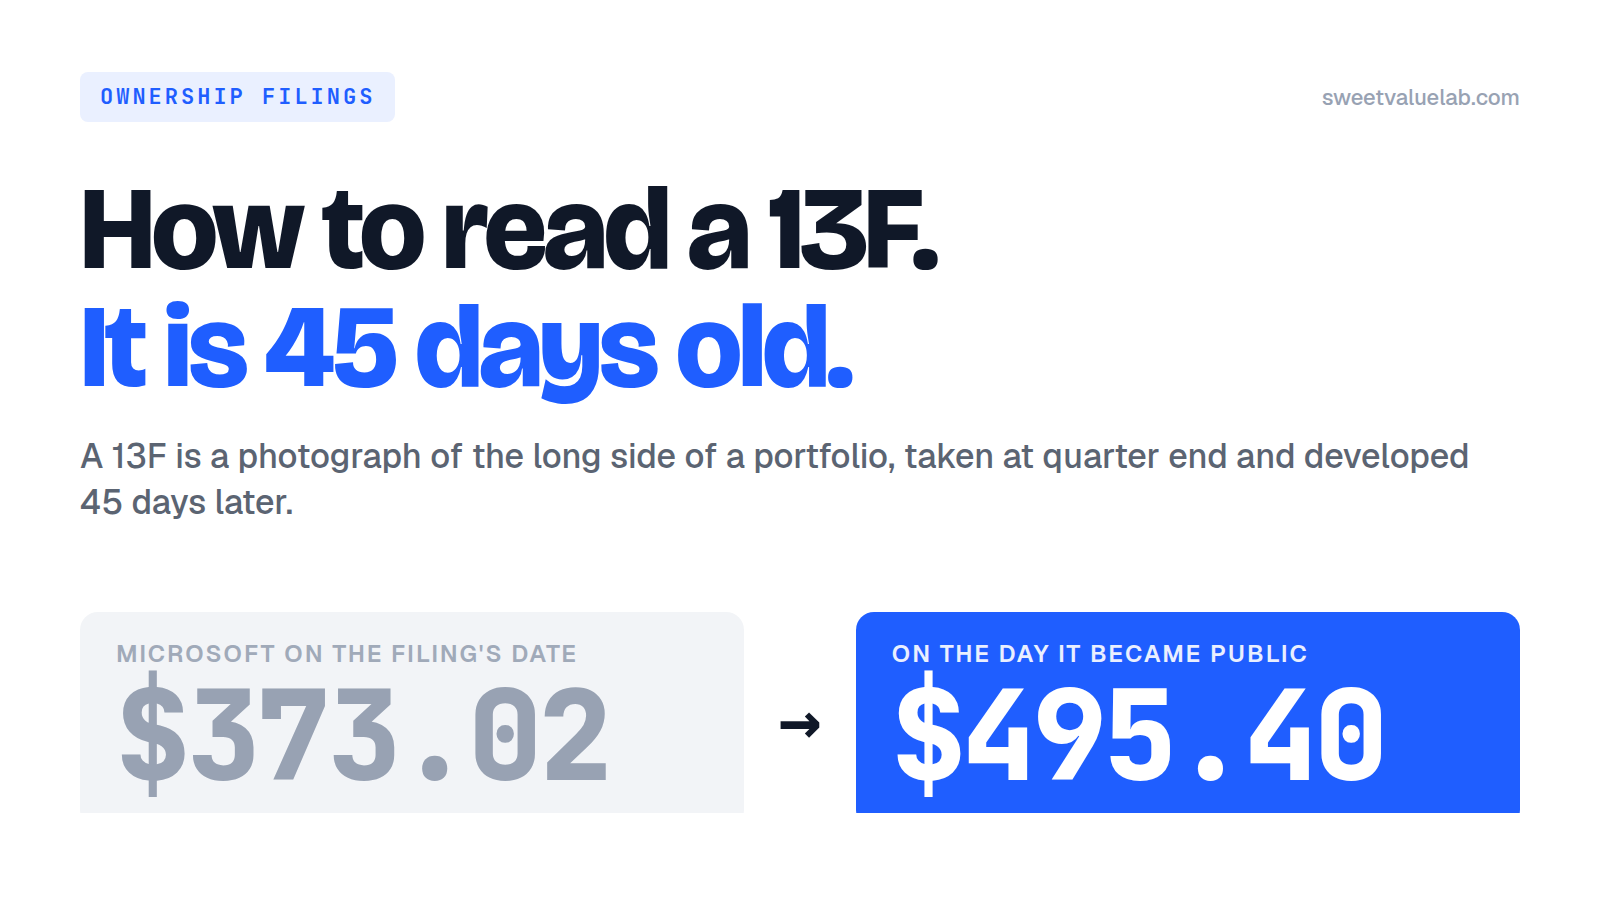
On Friday, August 14, 2026, the quarterly portfolios of the 82 managers tracked here became public. Every one of them describes a single day, and that day is June 30. Microsoft closed at $373.02 on June 30. On the day the filings appeared it closed at $495.40.
Nothing in those filings is wrong. A 13F is a photograph of the long side of a US portfolio, taken on the last day of the quarter and developed 45 days later. Read as a list of what a manager owns today, it misleads in a specific and predictable way. Read as what it is, it is one of the few places where a professional's decisions sit on the public record, quarter after quarter, and can be checked against what happened next.
This post starts from zero: what the form is, what the calendar does to it, what it never mentions, the questions people ask about it, and where to read one here.
What a 13F is
A 13F is a quarterly report of the US stocks an institutional manager holds, filed with the SEC and published for free. The requirement comes from section 13(f) of the Securities Exchange Act, which is where the form gets its name. Its formal title is Form 13F-HR, HR for "holdings report".
| Who files one | Any institutional manager with investment discretion over $100 million or more in the securities the SEC lists as reportable. Hedge funds, mutual fund families, pension plans, endowments, banks, large family offices. Below the line, nothing is filed at all. |
| How often | Four times a year, within 45 days of the end of each calendar quarter. |
| What one row holds | The company's name, the class of security, its CUSIP (a nine-character ID for a US security, the way a filing names a company), the number of shares, and what those shares were worth on the last day of the quarter. |
| What it costs to read | Nothing. Every filing sits on the SEC's EDGAR system, free, with no account. |
| What it is not | A trade log, a performance report, or a complete picture of a fund. It is one list, as of one date. |
The rest of this post is about that last line. Almost every mistake made with a 13F comes from forgetting it.
The calendar is most of the story
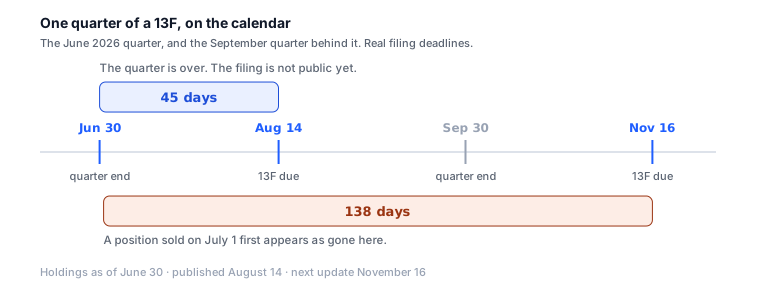
Every institutional manager holding more than $100 million in the securities the SEC lists as reportable files Form 13F-HR within 45 days of the end of a calendar quarter. That is the entire schedule. The June quarter ended on the 30th and was due on August 14. The September quarter ends on the 30th and is due on November 14, a Saturday, so it arrives on Monday the 16th.
Now follow one position through that schedule. A manager sells the whole thing on July 1. The June filing, published six weeks later, still lists it at its June 30 size, because on June 30 they held it. Nothing requires them to mention the sale. The position vanishes from the September filing, which is public on November 16 — 138 days after the trade.
That is the worst case. It is also the ordinary case for anything closed early in a quarter, which is a third of the calendar.
What the price did while you waited
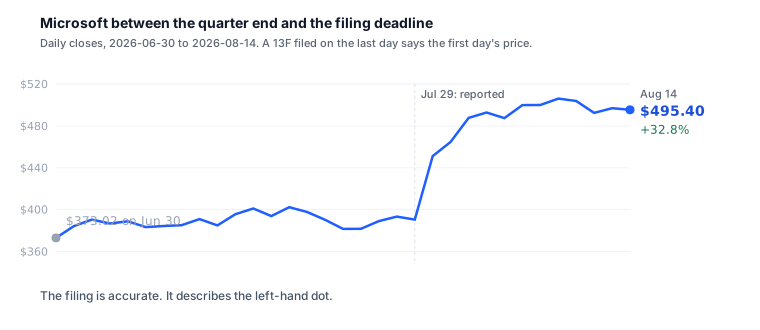
Microsoft reported on July 29 and closed 15% higher the next day. None of that is in the June filing. All of it is in the price by the time anyone can read the filing, so a reader who opens it on August 14 and thinks "this is what they hold" has the share count right and the money wrong. The same shares are worth a third more than the value column in the document.
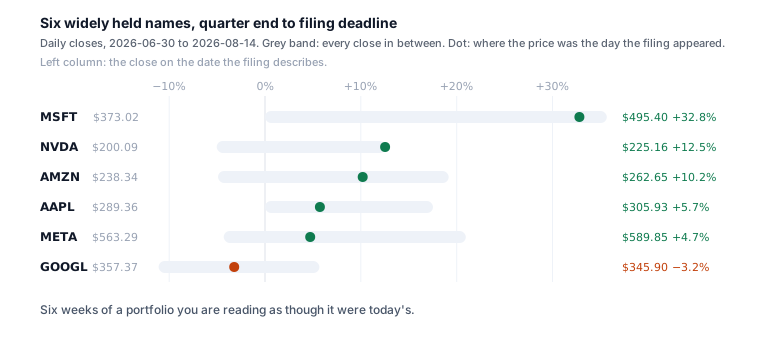
The median move across those six, quarter end to deadline, was 8.0%. Alphabet went the other way and ended 3.2% below where the filing found it. Apple closed at $340.08 on July 28 and at $305.93 on August 14, so the two dates that matter happen to bracket a round trip that appears nowhere in the document.
Six large caps in one window is an illustration of the size of that gap, drawn from one quarter. A quieter quarter looks tamer. What does not change is that the gap exists for every reader of every filing, and that it is unknowable at the moment you are reading.
What the form does not contain
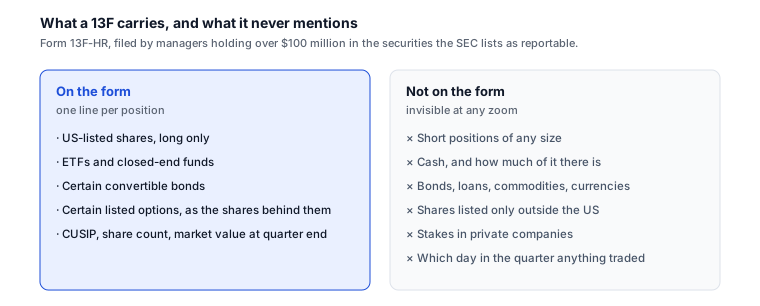
The omissions are the part most often forgotten, because a portfolio that lists twenty positions reads like a portfolio of twenty positions.
Short positions are not there, at any size. A manager who is long a stock and short its competitor files one of those two lines. The pair trade reads as a bet.
Cash is not there, and neither is anything that is not a reportable security. Bonds, loans, commodities, currencies, shares listed only outside the US, stakes in private companies: none of it appears. A percentage computed from a 13F is therefore a percentage of the reported book, and the fund behind it is larger by everything the form skips. For a long-only US stock picker the two are nearly the same number. For a manager who holds half a portfolio in Treasuries or in Tokyo, they are not, and the form gives you no way to tell which kind you are reading.
The date of any trade is not there. Two consecutive filings tell you a position grew by 400,000 shares. They do not say whether that happened in one purchase in April or in twelve through June, and a manager reporting an average cost is doing so voluntarily somewhere else.
One more thing is missing on purpose: a manager can ask the SEC for confidential treatment and leave a position out while building it, disclosing it later in an amendment. It is not common. It is enough to keep you from reading an absence as evidence.
A filing can be rewritten
An amended 13F is a real thing, filed as 13F-HR/A, and it can correct a share count or add positions that were held back. The original stays on EDGAR beside it. If a number you remember does not match the number on the screen, the filing changing underneath you is one of the explanations.
What it is genuinely good for
Strip out what a 13F cannot answer and a useful list remains.
- Direction across quarters. One quarter is a photograph; eight quarters are a sentence. A position built over two years and never trimmed says something a single snapshot cannot, and the lag matters far less when the thing you are reading is two years long.
- Concentration. What share of the reported book sits in the top ten names is knowable exactly, on the filing's own terms. A manager who ran 12 positions on June 30 was running roughly 12 positions six weeks later.
- A decision recorded before the outcome. The filing was made before anyone knew what the stock would do. That makes it a rare piece of evidence about how someone actually invests, as opposed to how they describe it in a letter afterwards.
- Who else is in the room. Reading one stock across 82 portfolios is a different question from reading one portfolio, and it is the question most people actually have.
Common questions
How often does a 13F come out?
Four times a year, within 45 days of the end of each calendar quarter. That is the whole cycle. The newest filing available on any given day is therefore between one day and about four and a half months old, depending on where in that cycle you are standing.
Who has to file one?
Any institutional manager with investment discretion over $100 million or more in reportable securities, measured on the last trading day of any month in the year. A manager below that line files nothing. That is why a small fund you follow may have no 13F at all. One who crosses the line starts at the next quarter end.
13F, 13D, 13G, Form 4: what is the difference?
They answer different questions, and only one of them is quarterly.
| Form | What triggers it | How soon it appears |
|---|---|---|
| 13F | holding $100M+ in reportable US securities | quarterly, 45 days after quarter end |
| Schedule 13D | crossing 5% of a company with an intent to influence it | days |
| Schedule 13G | crossing 5% passively | on its own schedule, faster than a 13F |
| Form 4 | an insider trading their own company's stock | two business days |
An insider here means an officer, a director or a holder of more than 10% — the insiders tab on any covered stock shows those.
Can I copy a manager's 13F?
Nothing stops anyone. The three facts in this post are what the attempt runs into. The price on your screen has already moved away from the price the manager paid; over the window above, the median gap was 8.0%. The form leaves out the short side and the cash, so the portfolio you are copying may be a fragment of the real one. And the position may already be closed, with the next filing months away. A 13F records what was held on one date. The cost, the reason and the rest of the portfolio are somewhere else.
Why do two websites show different holdings for the same manager?
Four ordinary reasons. The manager filed an amendment and one site re-read it. The two sites map CUSIPs to tickers differently, so an unmapped position shows under an issuer name on one and a ticker on the other. One site counts reported options as shares and the other does not. Or the manager files under several entities and the sites picked different ones.
Where can I read the original for free?
On EDGAR, the SEC's own filing system: search the manager by name, then open the 13F-HR. Everything on the investor pages here is read from exactly those filings, arranged so a quarter can be compared with the one before it.
How to read one here
The investor index lists all 82 managers with the quarter each has filed, the filing date, the position count and the portfolio value; a manager whose newest filing is a quarter behind everyone else's is flagged, because that is usually the first sign that a filer has moved to a new entity. A manager's own page — Buffett's, for instance — leads with the ten largest positions and what changed against the previous quarter, and the activity tab is the quarter as a set of differences: new, added to, trimmed, exited, with the share change on each. Those differences are computed from two consecutive snapshots, which is the only way anyone can compute them. The form itself never says a word about buying or selling.
For the reverse question, every covered stock has an ownership tab — Microsoft's — with the tracked managers holding it in their latest 13F, alongside the Schedule 13D and 13G filings above 5%. Those two are worth knowing about because they run on events instead of on the calendar: crossing five percent starts a clock, and for Schedule 13D, the activist version, that clock is measured in days. They are the fast half of the ownership picture, and a 13F is the slow half.
One last caveat, and this one is ours rather than the SEC's. A 13F identifies every holding by CUSIP. Tickers are our doing: each name on these pages came out of a mapping table maintained by hand, and a position whose CUSIP has not been mapped yet shows its issuer name where the ticker would be. That convention, and the rest of what happens to a filing between EDGAR and the screen, is in where the numbers come from.
Read this way, the lag stops being a flaw in the data and becomes the first fact about it. The filing is a photograph, it is six weeks old, and it is still the only photograph anyone has.
The weekly
The week's 13F filings, insider trades and earnings, plus new research on the site. One email a week, no account.
More posts
- Anthropic's $16.8B quarter: the investor day numbers
- What is a DCF? What a corner shop is worth
- How the 10-year Treasury moves every valuation on this site
- Delta vs United by the numbers
- Anthropic's IPO prospectus: the numbers behind the $42B loss
- How to read a market sentiment gauge
- Market breadth: the index can rise while most stocks fall
- How we value a stock: twelve models, one number
- Where the numbers come from: filings, point in time
- Tesla, taken apart: a sum of the parts in three scenarios
- How to read a reverse DCF: the growth a stock price implies
- How to value a bank: P/TBV, ROTCE and the line
- How to value a REIT: FFO, P/FFO and the yield spread
- How to value a software company: Rule of 40 and SBC
- Total return vs price return: what a stock chart leaves out
- What a backtest cannot tell you