Market breadth: the index can rise while most stocks fall
 Allen Yan · · 5 min read
Contents
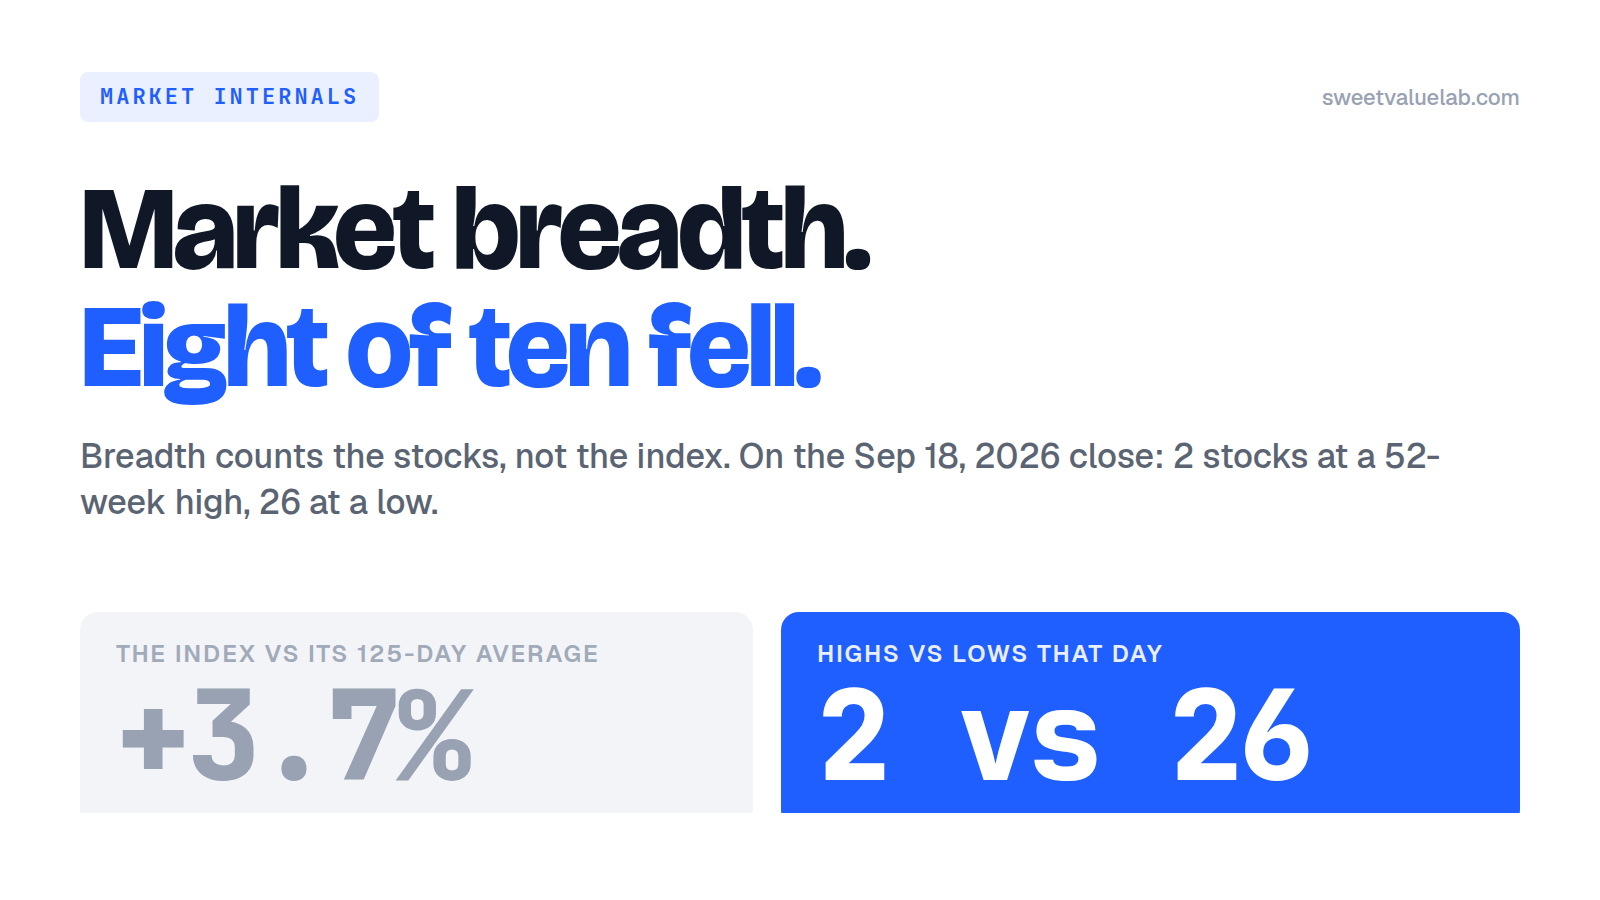
On the September 18, 2026 close the S&P 500 sat 3.7% above its 125-day moving average. Among the ~518 stocks the market sentiment gauge counts, 2 closed at a 52-week high and 26 closed at a 52-week low. Both sentences describe the same session. The first one is the index. The second one is breadth.
Breadth is the count of what the stocks did, taken without their weights. It gets watched because an index is an average a handful of companies can carry on their own, and the day the carrying starts looks like any other day on the index chart. This post takes the count apart: the arithmetic that lets the two numbers disagree, the four ways the disagreement is usually measured, and the two of them this site computes every night.
The arithmetic that lets them disagree
A cap-weighted index weights every company by its market value, so a company worth $3 trillion moves it thirty times as much as one worth $100 billion. Ten stocks are enough to show what that does to the average.
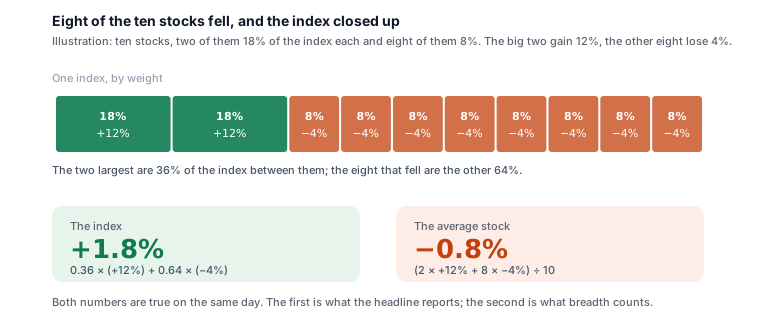
Nothing there is unusual. The top ten names in the S&P 500 have been around a third of it, and a third of the index is enough to outvote the other four hundred and ninety on any given day. Over years the same arithmetic is what the Magnificent 7 basket measures against the index it sits inside.
Counting stocks without their weights is how you get the second number in that figure. It is not the better one. It answers a different question: how many companies took part.
Four ways to count the average stock
The four below all count participation. They differ in what they count and how fast they move.
| Measure | What it counts | Here |
|---|---|---|
| Advance–decline line | Stocks up minus stocks down each day, accumulated | Not published; the volume version below is |
| Net new highs and lows | Stocks at a 52-week closing high minus those at a 52-week low | The gauge's fifth factor, stock price strength |
| McClellan volume summation | Net advancing volume, smoothed twice and accumulated | The gauge's sixth factor, stock price breadth |
| Equal weight against cap weight | The same basket, weighted two ways, as a ratio | Not published |
The first and the last are the easy ones to describe and the ones this site does not compute. The middle two it does, every night, over the S&P 500 and Nasdaq-100 constituents that make up the public universe. The rest of this post is about those two, because a number you can see the inputs of is worth more than one you can only read about.
Net new highs minus new lows
Count the stocks that closed at the highest price of their trailing 252 sessions, subtract the ones that closed at the lowest, and divide by the stocks that had a full year of history to be measured against. On September 18, 463 of the universe cleared that bar: 2 highs against 26 lows, so −5.2%.
A stock needs a year of prices before it can be counted at all, That is why the denominator was 463 that day. Recent listings sit out. So do stocks that joined an index last month. The count also moves fast, because a 52-week high is a fact about one session and a stock can lose the status the next day.
That −5.2% ranked in the 2nd percentile of the factor's own last 504 trading days. Two years is the whole context here: on a similar day in a market that had already spent a year making new lows, the same −5.2% would read as unremarkable.
Advancing volume, and the two EMAs on top of it
The other measure counts volume. Each day, the volume of every stock that closed up, minus the volume of every stock that closed down, as a share of the volume traded across the universe, times a thousand. That number is jumpy enough to be useless on its own, so it gets smoothed: a 19-day exponential moving average minus a 39-day one, which is the McClellan oscillator. Add every oscillator reading since the series began and you have the summation.
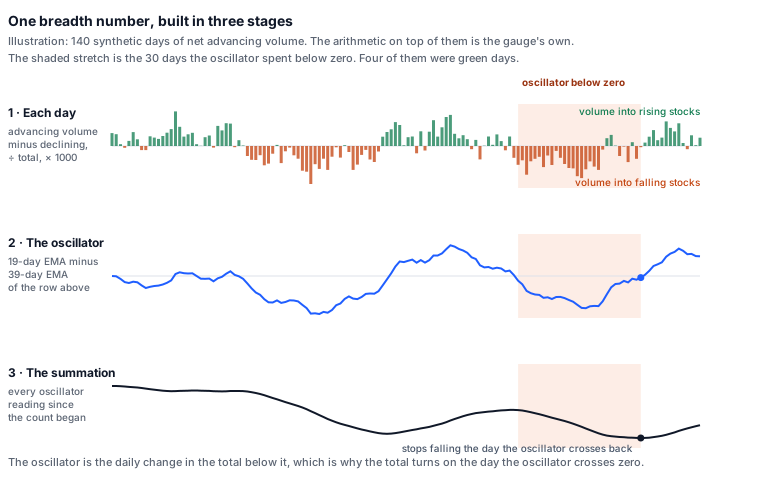
The figure's middle panel is the reading that gets quoted. On September 18 the oscillator was −44, meaning the recent flow into falling stocks had been outrunning the flow into rising ones for weeks, and the running total had been sliding for as long as that stayed true.
Two things about this measure are worth holding onto. It weights by volume, so a heavily traded stock counts for more than a quiet one, which makes it a different question from the highs-and-lows count. And it is slow by construction: the 39-day leg means a week of good days moves it a little.
The level is arbitrary
The summation starts at zero on the first day of the series, so its level says as much about that date as about the market. The gauge stores that origin with every row and only ever uses the percentile.
What a divergence does not tell you
A breadth reading and an index reading pointing opposite ways describe one day. That is all they do. It is tempting to read the next move into it, and the band table in the gauge's own guide is a fair warning about how that goes: the extreme-fear rows there point down at 20 trading days and up at 60, off 68 days that belong to three or four episodes.
The same caution applies to any rule built on a divergence. A test over two years of readings inherits every limit a backtest has, starting with the one window it happened to run on. Narrow breadth has preceded drawdowns. It has also run for months while the index kept climbing. Nothing in the count says which one today is.
Where to read it here
The gauge's fifth and sixth cards carry both measures with their raw inputs printed: the highs and lows counted that day, the oscillator, the summation and each one's percentile. The gauge updates once a day after the US close.
For a narrower version of the same question, the sector boards count a fixed list each: the bank board, the REIT board and the software board each show how their names are doing against one set of formulas, which is breadth of a sort with the stocks named. The definitions behind every factor, this one included, are in the gauge's own guide.
The weekly
The week's 13F filings, insider trades and earnings, plus new research on the site. One email a week, no account.
More posts
- Anthropic's $16.8B quarter: the investor day numbers
- What is a DCF? What a corner shop is worth
- How the 10-year Treasury moves every valuation on this site
- Delta vs United by the numbers
- Anthropic's IPO prospectus: the numbers behind the $42B loss
- Who actually owns this stock: how to read a 13F
- How to read a market sentiment gauge
- How we value a stock: twelve models, one number
- Where the numbers come from: filings, point in time
- Tesla, taken apart: a sum of the parts in three scenarios
- How to read a reverse DCF: the growth a stock price implies
- How to value a bank: P/TBV, ROTCE and the line
- How to value a REIT: FFO, P/FFO and the yield spread
- How to value a software company: Rule of 40 and SBC
- Total return vs price return: what a stock chart leaves out
- What a backtest cannot tell you