How the 10-year Treasury moves every valuation on this site
 Allen Yan · · 6 min read
Contents
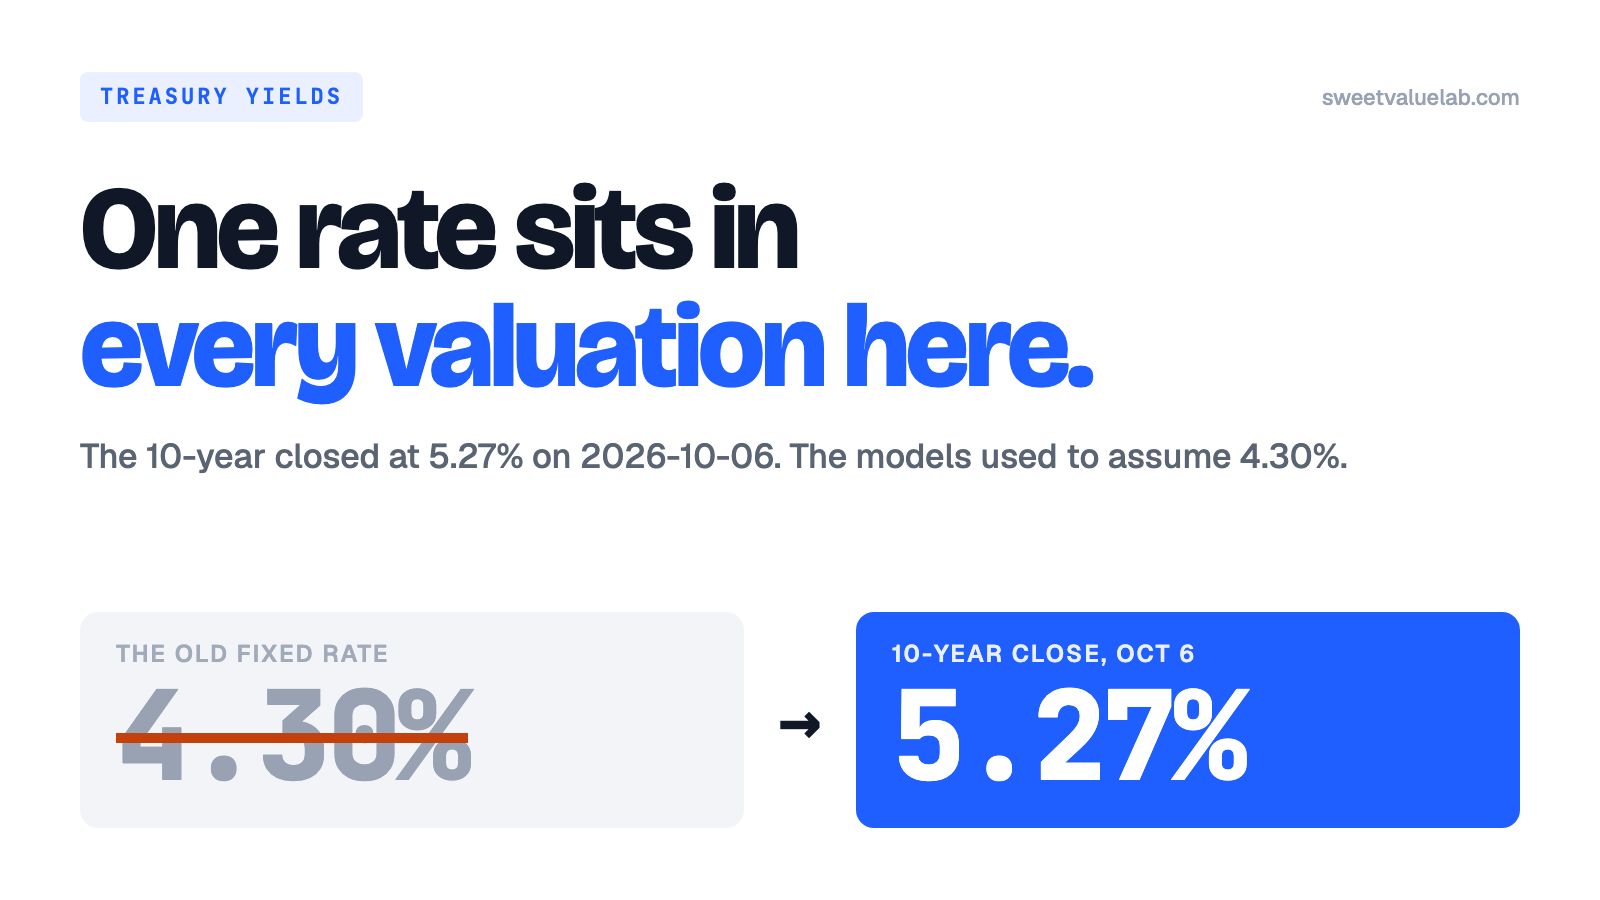
Until the first week of October 2026, every discounted cash flow model on this site used a risk-free rate of 4.30%. The number was a constant in a config file. On October 2 the 10-year Treasury closed at 5.28%, so every DCF, every dividend discount model and every earnings power value here was discounting the future at a rate about one point below the market's.
That constant is gone. The models now read the latest 10-year close from the U.S. Treasury's own daily file each night, before they revalue anything. On the 2026-10-06 close it was 5.27%. This post walks through where that number enters a valuation, how much it moved the site's figures when it changed, and what the Treasury yields page shows about the rate itself.
Where the 10-year enters
A cash-flow model values a company by discounting what it is expected to earn later back to today. The discount rate for the equity holders is built on the 10-year:
cost of equity = risk-free rate + beta × equity risk premium
               = 5.27%          + 1.00 × 4.14%
               = 9.41%           (a stock with a beta of 1.0)
The equity risk premium of 4.14% is Aswath Damodaran's implied premium for the S&P 500 as of September 1, 2026, and it is reviewed once a quarter. The risk-free rate moves every night. It also sets a floor under the cost of debt: a company's borrowing rate is never taken below the 10-year plus 1.5 points, which on the October 6 close is 6.77%.
Three kinds of model use that rate directly: the growth DCFs (five and ten years, then a terminal value), the dividend discount model, and earnings power value, which capitalises today's operating profit at the cost of capital. The EBITDA-exit DCFs use it too, but their terminal value comes from a multiple, so the rate reaches only the years before the exit.
Multiples do not use it at all. A P/E or an EV/EBITDA compares a company with its peers today, and neither carries a discount rate. The three sector models (banks on price to tangible book, insurers on price to book, REITs on price to funds from operations) use fixed required returns of their own.
What 98 basis points did
Before the change went live, the same inputs for 508 stocks were valued twice: once at 4.30% and once at 5.28%, with the equity risk premium held where it was. Nothing else moved.
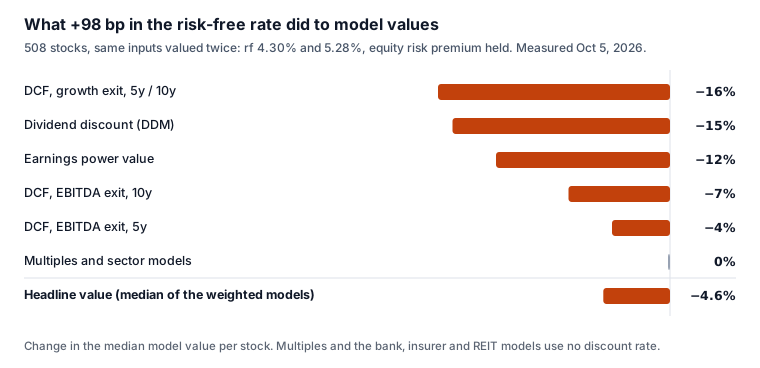
The headline value on each stock page is the median of the models that count for that kind of business. The multiples sit in that median. They did not move. So the headline fell far less than any single cash-flow model: 4.6% at the median stock. The stocks valued mostly on cash flows moved the most. Kroger's model value fell 27%, J.M. Smucker's 25% and AutoZone's 20%.
For 38 of the 508, the change was enough to move the price from below the model value to above it, or the other way.
Why the latest close and not a 30-day or 200-day average: a page can then say exactly which rate it used ("10-year Treasury 5.27%, as of October 6"), and every stored valuation records the rate and its date, so an old one can be replayed. An average would smooth the nightly moves at the cost of never matching any rate a reader can look up.
What moved the 10-year this year
Over the 12 months to October 6 the 10-year rose 117 basis points. A rise like that can come from two places, and the Treasury publishes enough to tell them apart. Next to the nominal curve it publishes a real curve, the yields on Treasury Inflation-Protected Securities. The nominal yield minus the real yield is breakeven inflation, the inflation rate at which the two bonds would pay the same.
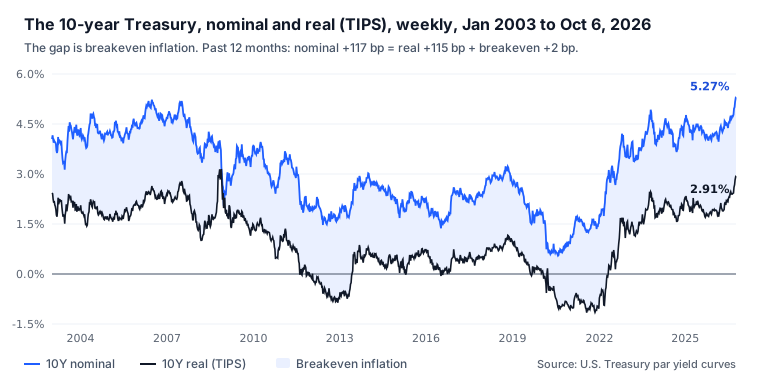
Almost all of it was the real yield. Of the 117 basis points, 115 were real. Breakeven inflation moved 2. At 2.91% the 10-year real yield is the highest since November 2008. Over the last three months the split was less one-sided, 60 basis points real and 11 breakeven.
The short end moved too. The 2-year rose 124 basis points over the same year, more than the 10-year. Over the last three months the 2-year rose 58 and the 10-year 71, a bear steepener in the vocabulary of rates desks: yields up, the long end up a little more.
Try it: on the Treasury yields page, "Why did yields rise?" switches the nominal and real chart between three years, ten years and the whole series since 2003.
What the curve has said before
The spread between the 10-year and the 3-month bill is the one the New York Fed's recession model uses. Below zero, the curve is inverted: three-month money pays more than ten-year money.
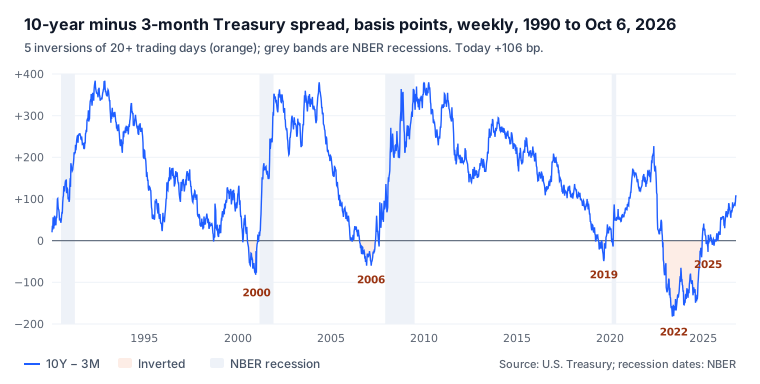
Since 1990 there have been five inversions of 20 trading days or more:
| Inverted from | Back above zero | Days inverted | Deepest | Next recession began | Months after start |
|---|---|---|---|---|---|
| Jul 7, 2000 | Feb 12, 2001 | 134 | −95 bp | Mar 2001 | 8 |
| Jul 17, 2006 | May 30, 2007 | 218 | −64 bp | Dec 2007 | 17 |
| May 13, 2019 | Oct 11, 2019 | 99 | −52 bp | Feb 2020 | 9 |
| Oct 18, 2022 | Dec 13, 2024 | 535 | −189 bp | none so far | — |
| Feb 26, 2025 | Sep 16, 2025 | 85 | −27 bp | none so far | — |
Three were followed by a recession, and in each of the three the recession began after the spread was already back above zero. The fourth was the longest and the deepest on record here, and no recession has been dated since it ended. The fifth crossed zero repeatedly for seven months and spent 85 of its days below it, which is why the page labels it intermittent.
Five cases is a small sample. The table is a record of what followed each one. It does not support a probability for the next.
The equity side of the same rate
If the 10-year pays 5.27% with no credit risk, it is fair to ask what stocks are earning against their prices. The page answers with the trailing earnings yield of the covered stocks: total net income over the last four filed quarters divided by total market value, counting only what had been filed by each month-end.
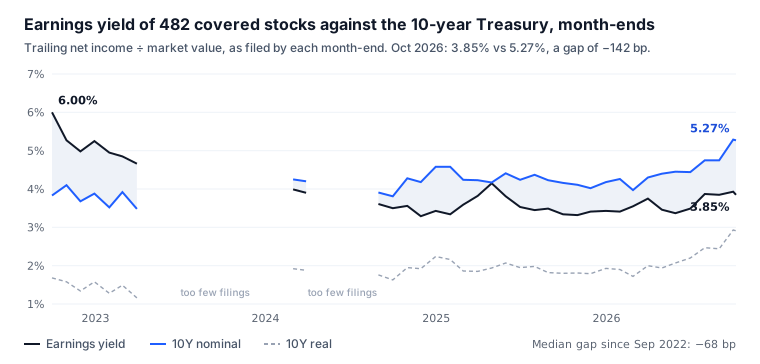
On October 6 the 482 stocks earned 3.85% of their market value against 5.27% on the 10-year, a gap of −142 basis points. That is the lowest of the 36 month-ends the series has, and the median since September 2022 is −68. Against the real yield the gap is +94.
The chart has two holes. From April 2023 to January 2024, and again from April to July 2024, fewer than 70% of the stocks had four consecutive quarters on file at the month-end, and the series leaves those months out rather than average over a partial universe. Where a company's fourth quarter appears only inside its annual report, it is derived as the year's net income minus the three quarters before it.
How unusual this rise is
A rise of 100 basis points or more inside 12 months has happened 16 times since 1990. This one is 134 basis points from the February 27, 2026 low of 3.97%. This one sits mid-table. The two largest were 2022, when the 10-year went from 1.35% to 4.25% (290 bp), and 1994, from 5.26% to 7.86% (260 bp).
What the page does not tell you
It does not forecast rates, and the answers at the top of each section are generated from the night's numbers, so they will read differently tomorrow. Term premium and Treasury auction results are not on it yet. The sensitivity figures above were measured once, on October 5, and will be measured again when the models change.
None of this is advice. The Treasury yields page updates after each Treasury close, and every stock page records the rate it was valued at.
The weekly
The week's 13F filings, insider trades and earnings, plus new research on the site. One email a week, no account.
More posts
- Anthropic's $16.8B quarter: the investor day numbers
- What is a DCF? What a corner shop is worth
- Delta vs United by the numbers
- Anthropic's IPO prospectus: the numbers behind the $42B loss
- Who actually owns this stock: how to read a 13F
- How to read a market sentiment gauge
- Market breadth: the index can rise while most stocks fall
- How we value a stock: twelve models, one number
- Where the numbers come from: filings, point in time
- Tesla, taken apart: a sum of the parts in three scenarios
- How to read a reverse DCF: the growth a stock price implies
- How to value a bank: P/TBV, ROTCE and the line
- How to value a REIT: FFO, P/FFO and the yield spread
- How to value a software company: Rule of 40 and SBC
- Total return vs price return: what a stock chart leaves out
- What a backtest cannot tell you