How to read a reverse DCF: the growth a stock price implies
 Allen Yan · · 12 min read
Contents
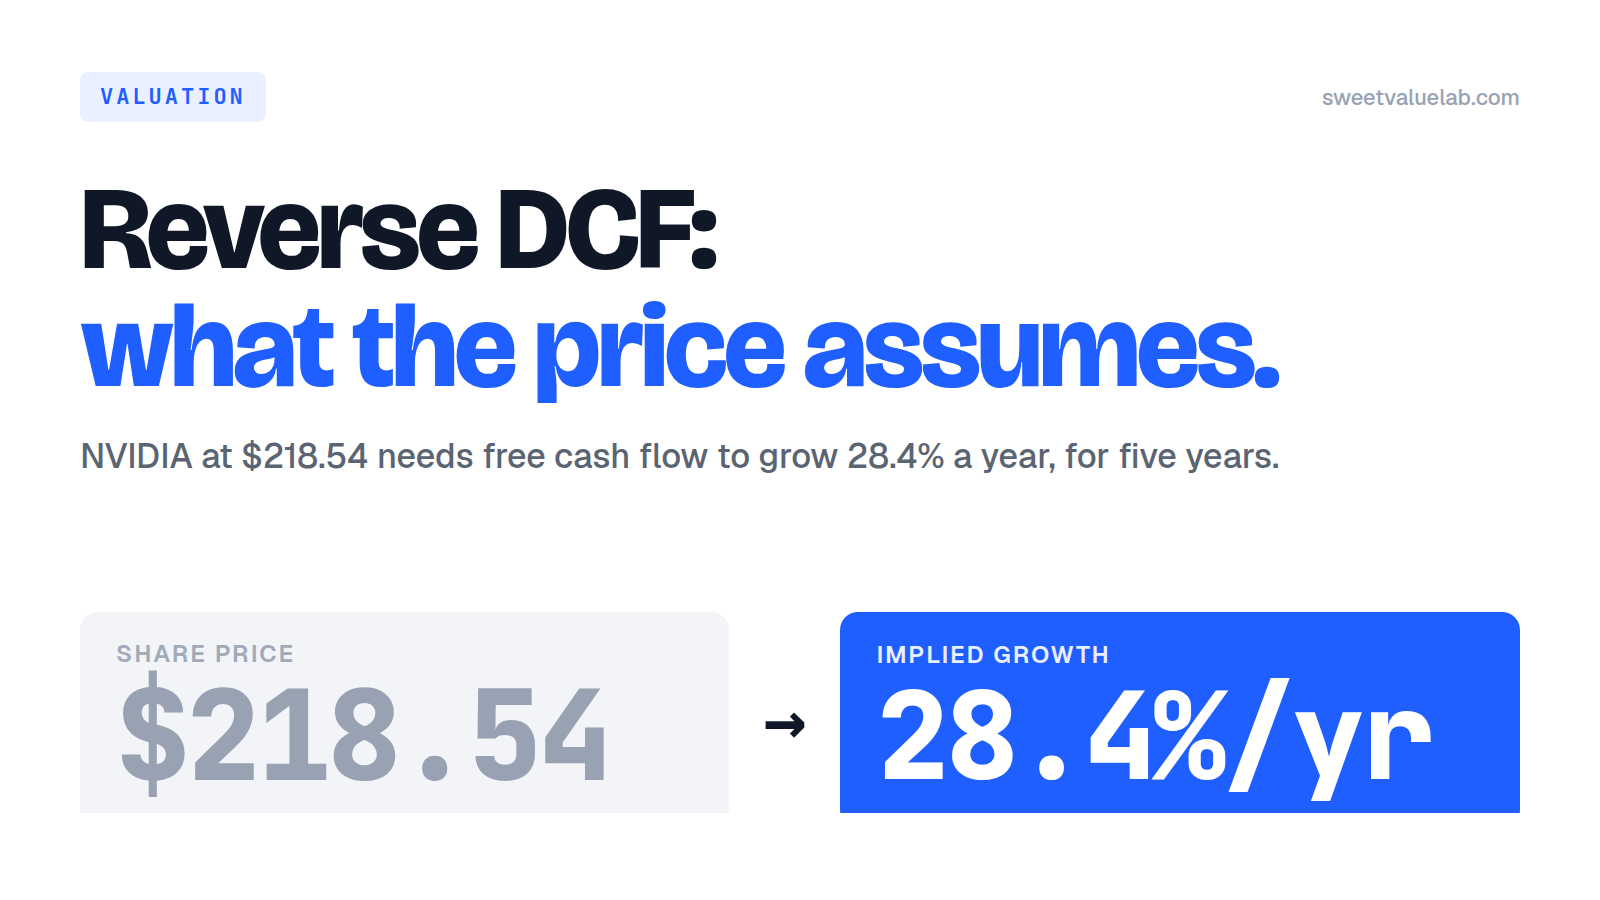
Look up NVIDIA on a screener and you get a P/E of 45. Open its valuation page here and the reference model lands at $95 a share against a $218.54 price, a 130% premium to the model. Both numbers are correct. Neither tells you what to think, because both are answers to a question you did not ask. The P/E compresses the future into one ratio with no time in it. The model prints a value that depends on a dozen assumptions you cannot see from the outside. Worse, it reads like a verdict.
There is a better question: what does the price already assume? This guide walks through the way to answer it, one step at a time, using NVIDIA (NVDA) on the 2026-09-18 close. Every figure comes from the same filed statements the stock page shows, and every step can be repeated on NVDA's reverse-DCF page, then on any of the hundred companies the tool covers. If you have read the bank, REIT or software guides, this one has the same shape, with one difference. It covers no sector at all. It is about turning any valuation model inside out.
Step 1: A DCF has one unknown too many
A discounted-cash-flow model is simple in principle. Guess the cash the business will produce each year. Discount each year back to today at the return you require, add the pieces up, and you have what the business is worth. Divide by the shares and you have a value per share to hold against the price.
The trouble is in the word guess. To get a number out, you have to put in a growth rate, a margin path, a capital-spending path, a terminal growth rate and a discount rate. The output is only as good as the least defensible of those. Two careful analysts can land at $95 and $250 from the same statements. Both show their work. That is why a DCF's value per share is so often quoted and so rarely trusted.
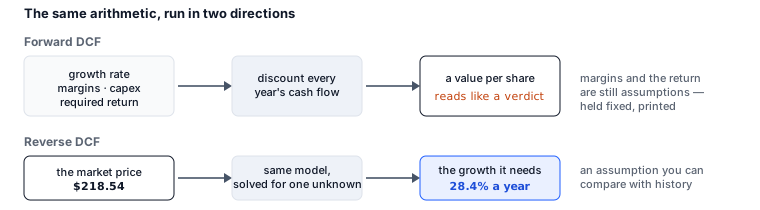
A reverse DCF keeps the arithmetic and changes which number is unknown. It takes the market price as given and solves for the growth: how fast would free cash flow have to grow for this price to be exactly fair at the return I require? The answer is neither a value nor a verdict. It is an assumption, the market's, made visible. An assumption is something you can argue with.
Step 2: What the price says the cash flows must be worth
Start with what a buyer of the whole company at today's price would be paying for, and what they would get in return this year.
The price is $218.54 and there are 24.22 billion shares, so the market cap is $5.29 trillion. That buys the shares; the business behind them also holds cash and owes debt. Start from the January 2026 balance sheet. NVIDIA had $62.6B of cash and short-term investments against $11.4B of debt, so $51.1B of net cash. The operating business itself is priced at $5.24 trillion of enterprise value:
EV = market cap − cash and short-term investments + debt = $5,293B − $62.6B + $11.4B = $5,242B
Now the cash the business produced in its latest fiscal year. Operating cash flow was $102.7B. Capital expenditure was $6.0B. Free cash flow was $96.7B. Divide: the enterprise value is 54.2 years of today's cash flow. That ratio is the whole question in one number. Nobody pays fifty-four years of cash for a business whose cash will stay flat. They pay it because they expect the cash to grow. The reverse DCF asks: by how much?
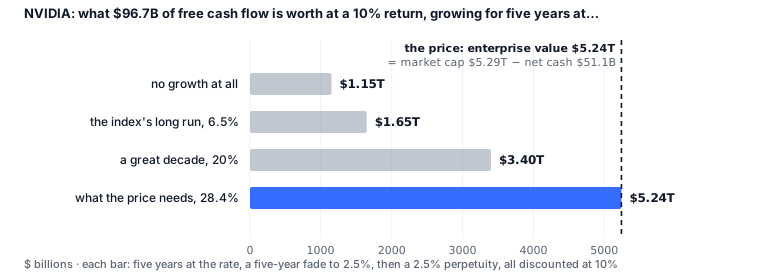
The figure shows why the growth is the whole story. At a 10% required return, NVIDIA's cash flow held flat is worth about $1.15 trillion, a fifth of the price. Growing at the stock market's long-run rate of 6.5% a year for five years, $1.65 trillion. Growing at 20% a year, a great decade for any large company, $3.40 trillion, still a third short. The dashed line is what the market paid.
Try it: look at the four figures across the top of NVDA's page. They are exactly these: the close with the enterprise value beneath it, the base-year free cash flow with how it was built, EV / FCF, and the answer. The footer of the page prints the balance-sheet lines it used.
Step 3: Solve for the growth
To turn "how much growth" into one number, the cash flow needs a fixed shape, so that every company is asked the same question. The page uses the simplest shape that does not require a cliff:
- years 1–5: free cash flow grows at one rate, g, the unknown;
- years 6–10: the growth fades in a straight line from g to a terminal rate of 2.5%, roughly the long-run growth of the economy;
- after year 10: a perpetuity at 2.5%.
Every year's cash is discounted at the required return, 10% here, and so is the perpetuity. Then the pieces are added. Then g is moved until the total equals the $5.24T enterprise value. (The page does this by bisection; the value rises smoothly with g, so there is exactly one answer when there is any.)
For NVIDIA at 10% the answer is 28.4% a year.
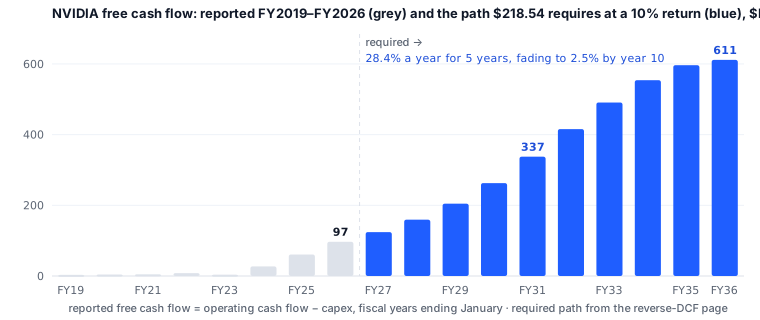
Read the blue bars as well as the rate. The path takes free cash flow from $96.7B to $337B in FY2031 and $611B in FY2036, 6.3 times this year's figure, and then keeps it growing at 2.5% forever after. About 61% of the $5.24T sits in that "forever after": the terminal value. That share is normal for a growth company and is the reason the page draws every year of the path. A DCF that shows you only the end number can hide almost anything in the terminal.
Two things the number is not. It is no kind of forecast, and nobody at the page thinks NVIDIA's cash flow will follow that exact path. It is no kind of value either: the page has taken the price as fixed and will not tell you whether $218.54 is the right one. What it tells you is what a buyer at $218.54 is implicitly agreeing to.
Try it: the "cash flow the price needs" panel on the page draws this chart. Change the required return above it and watch the blue bars move while the grey ones stay put.
Step 4: Is 28.4% a lot? Two comparisons that work
A rate on its own means nothing. Two comparisons make it mean something.
Against what has happened. The page puts the priced-in rate on a ruler from 0 to 100% a year, with the reference marks that matter.
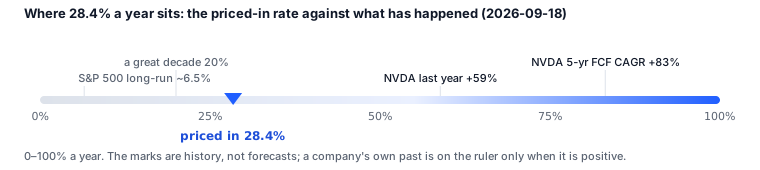
Two readings come off the ruler at once, and they pull in opposite directions. Against the index, 28.4% a year for five years is extraordinary: four times the long-run rate, and well past what "a great decade" looks like. Against NVIDIA's own past, it is a deceleration: the company grew free cash flow 59% last year and 83% a year over five. Both readings are true. The question the ruler poses is the right one: is NVIDIA's next five years more like its own last five, or more like everyone else's?
Against companies asked the same question. The tool covers a hundred companies, so the same number can be read across them.
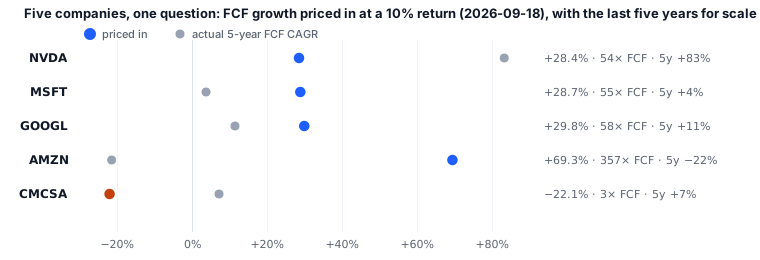
Microsoft and Alphabet are priced for almost exactly the growth NVIDIA is, 28.7% and 29.8%, and both grew far more slowly over the past five years. That is the comparison that should make you stop. The market is asking three companies for the same next decade, and one of them has just delivered it while the other two have not. Comcast is priced for its cash flow to shrink 22% a year. A price that expects decline is a very different conversation from one that expects growth.
And one comparison that does not work. Amazon's 69% looks like the most demanding price on the chart. It is mostly an artefact. Amazon's free cash flow in its latest year was depressed by a capital-spending surge. The base the path starts from is a fraction of what the business earns in a normal year, and climbing out of that hole takes enormous growth. A reverse DCF measures growth from the base year. Make that year unusual, with a capex peak, a one-off charge or a pandemic, and the number ends up measuring the base year instead of the price. The cure is to know what kind of year the base was, which is why the page prints the reported history beside the path.
Try it: the "Anchors" panel on every page lists the company's own five-year, three-year and last-year growth, revenue as well as cash flow, and the consensus next-year revenue growth where an estimate is on file. Read the ruler with them.
Step 5: The other half of the answer: the return you require
Every figure so far said "at a 10% return", and the qualifier is not small print. The required return and the required growth are two halves of one equation: demand more return and the same price needs more growth to deliver it.
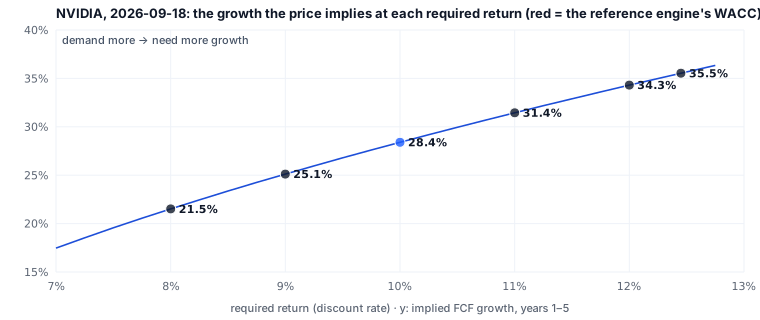
Between 8% and 12% the implied growth moves from 21.5% to 34.3%. That is thirteen points, more than any other switch on the page moves it. There is no escaping it: the number you demand from a stock is a choice, and the reverse DCF makes the cost of the choice explicit. The page defaults to 10%, which is about what the US stock market has returned over long periods and what most hand-built models on large companies use. The reference engine's own figure for NVIDIA is higher, 12.4%, because it builds the rate from the stock's beta of 1.8. The page offers that rate as a switch and marks it in the sensitivity table, so you can see both.
If you find yourself with a stronger opinion about the growth than about the return, the page will run the equation the other way.
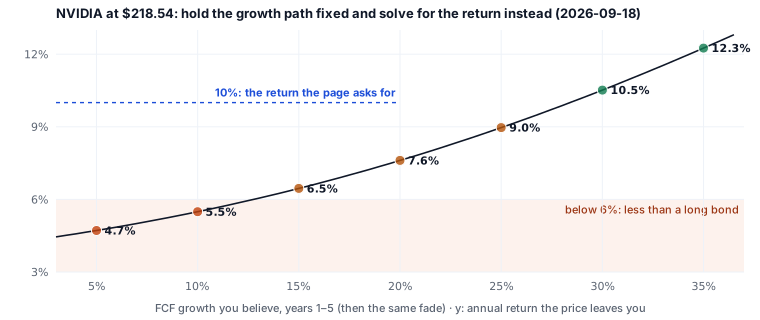
Believe 20% a year for five years, a great decade, and the price leaves you 7.6% a year. Believe 30% and it leaves 10.5%. Believe the company will grow like the index, and you are accepting 4.7%, which a ten-year Treasury pays without the risk. The table on the page colours these against fixed thresholds: under 6% orange, 6–9% amber, above 9% green. Those thresholds are the only opinion in it.
Try it: the "Required return" switch above the big number re-solves everything; the "Flip it" panel is the table above. Pick whichever side of the equation you have a view on and read the other.
Step 6: What moves the answer, and what breaks it
Besides the required return, the page has two switches, and it is worth knowing how much each is worth.
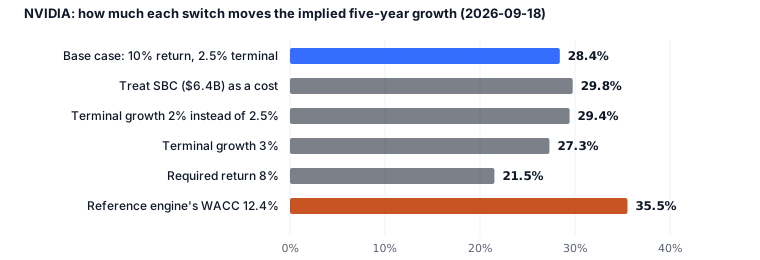
Stock-based compensation. Free cash flow as reported does not subtract the stock a company pays its employees, because no cash leaves; the shareholders are paid in dilution instead. The "treat SBC as a cost" switch subtracts it from the base. For NVIDIA it is $6.4B against $96.7B of free cash flow, and the requirement moves from 28.4% to 29.8%, a point and a half. For a software company paying a fifth of its revenue in stock the same switch can double the answer, which is the reason the software guide spends a whole step on it.
The terminal rate. Moving it from 2.5% to 2% or 3% moves the answer by about a point either way. Small, because the fade already forces the path down to the terminal rate by year ten. The terminal is a floor the path lands on, and pulling it does little.
When the page says "no solution". Three of the hundred companies had negative free cash flow in their base year: Oracle, Intel and Boeing on this day. The page says so instead of printing a number, because you cannot grow a cash flow that is below zero. That is the method working. It is telling you to start somewhere other than the latest year, and that the first job is to decide what a normal year looks like for that company. The same caution applies, more quietly, to a company whose base year was a peak. A path that starts from a peak needs less growth to reach the price. The number will flatter it.
Slim statements. For about twenty companies the data provider's annual statement lacks a capex, debt or cash line. The page fills the gap from the same year's ratio row, free cash flow per share times the share count and so on, and says so in its footer. It is a reasonable stand-in for the filed figure, and the note is there so you know which you are reading.
Step 7: Put it together: five minutes with any stock
Open a company on the tool and go down this list.
- EV / FCF. How many years of today's cash flow are in the price? Under 15, the price is mostly about the cash flow that exists; over 40, it is mostly about growth, and the rest of the page is where the argument is.
- What kind of year was the base? Look at the grey bars. A base year that is a peak, a trough or a capex surge changes the meaning of everything below it. If the page says "no solution", this is why.
- The big number, at 10%. Then read it on the ruler: against the index's 6.5%, against a great decade's 20%, against the company's own past.
- The path in dollars. What does free cash flow have to be in year five and year ten? A rate can sound plausible while the dollar figure sounds absurd, or the reverse.
- The sensitivity table. If the answer at 8% and at 12% are both numbers you could believe, the price is not saying much. If one is easy and the other impossible, your required return is the decision.
- Flip it. At the growth you actually believe, what does the price pay? Compare that with a long bond, and with what the same money earns in the index.
- The switches. SBC on: does the answer move? If it moves a lot, the cash flow was partly paid for in shares, and Step 3 was too kind.
It takes longer to read than to do.
What the page cannot tell you
- Whether the margin holds. The path grows free cash flow directly; it does not model revenue, margin and reinvestment separately. A 28% cash-flow path could be 20% revenue growth with rising margins or 35% with falling ones, and those are different businesses. The financials page has the margin history.
- What the market is actually thinking. The reverse DCF recovers the growth consistent with the price under one fixed shape. Real buyers hold a spread of views, on a spread of time frames, some of them not about cash flow at all. The page's answer is the growth a single, patient, cash-flow-only buyer would need. A useful fiction, and a fiction.
- The right required return. 10% is a convention. The page shows the answer at five rates and at the engine's own, because the choice belongs to you.
- Anything about the next quarter. The path is ten years long. A stock can be priced for 28% a year and fall 30% next month on a guidance cut. The number describes a decade.
None of this is advice. A rate on a ruler describes what a price assumes on a given day, under a stated shape, at a stated return. The page is there so that the next question you ask is the right one, and after this guide you know which one that is.
The weekly
The week's 13F filings, insider trades and earnings, plus new research on the site. One email a week, no account.
More posts
- Anthropic's $16.8B quarter: the investor day numbers
- What is a DCF? What a corner shop is worth
- How the 10-year Treasury moves every valuation on this site
- Delta vs United by the numbers
- Anthropic's IPO prospectus: the numbers behind the $42B loss
- Who actually owns this stock: how to read a 13F
- How to read a market sentiment gauge
- Market breadth: the index can rise while most stocks fall
- How we value a stock: twelve models, one number
- Where the numbers come from: filings, point in time
- Tesla, taken apart: a sum of the parts in three scenarios
- How to value a bank: P/TBV, ROTCE and the line
- How to value a REIT: FFO, P/FFO and the yield spread
- How to value a software company: Rule of 40 and SBC
- Total return vs price return: what a stock chart leaves out
- What a backtest cannot tell you