How to value a software company: Rule of 40 and SBC
 Allen Yan · · 10 min read
Contents
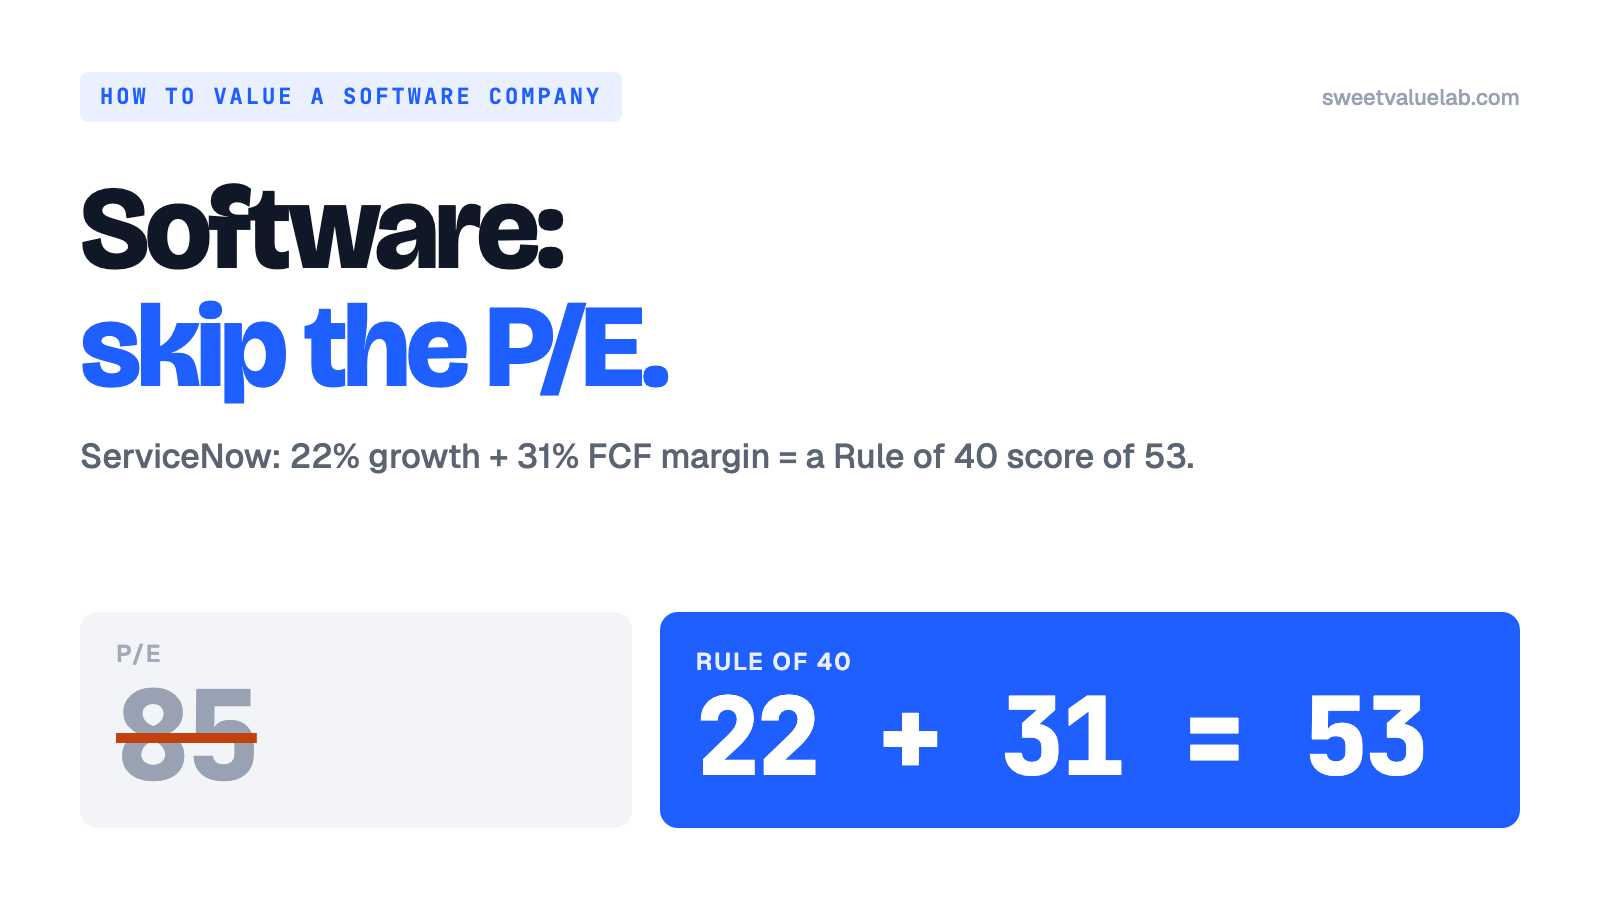
Look up ServiceNow on a screener and you get a P/E of 85. CrowdStrike shows a P/E in the thousands; Snowflake and Cloudflare have no P/E at all, because they report losses. Every one of those numbers is real, and none of them will help you decide anything, because for a software company the "E" in P/E is the residue of two accounting choices that have little to do with how the business is doing.
This guide walks from that dead end to a method that works, one step at a time, using ServiceNow (NOW) on the 2026-09-18 close as the worked example. Every figure comes straight off the software board, so you can follow along on NOW's card and then repeat the exercise for any name on it. If you have read the bank or REIT guides, you know the pattern: find the number the industry actually runs on, price it, then ask what could break it.
Step 1: Follow a dollar of revenue
Start with what a software company does with its money, because the shape of the income statement is the whole story.
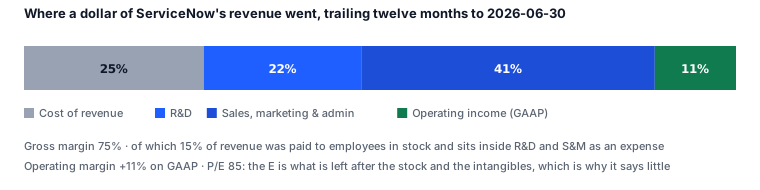
Two things stand out. The gross margin is 75%: once the software exists, delivering it to one more customer costs very little. That is the economic reason the sector exists and the reason its multiples are high. And then almost all of that gross profit is spent, on building the next version and on selling this one, leaving an operating margin of 11%.
That 11% is the number the P/E is built on, and it has two problems. First, a big slice of the R&D and sales cost is not cash: it is stock handed to employees, about 15 cents of every revenue dollar at ServiceNow, which the rules require to be expensed. Second, companies that grew by acquisition carry amortization of the intangibles they bought, another non-cash charge. Strip those and the "real" margin is much higher; leave them in and a fast-growing company can show a loss for a decade while generating cash the whole time.
So earnings are the wrong place to start. Revenue, gross profit and the cash-flow statement are where the information is. The next four steps use them.
Step 2: The trade-off, and the Rule of 40
Every software company faces one decision over and over: spend the gross profit on growth, or keep it. A company can put every dollar into sales and engineering and grow at 40% a year while breaking even, or spend almost nothing and grow at 5% with a 35% cash margin. Both can be excellent businesses. Neither growth nor margin alone tells you which is doing better.
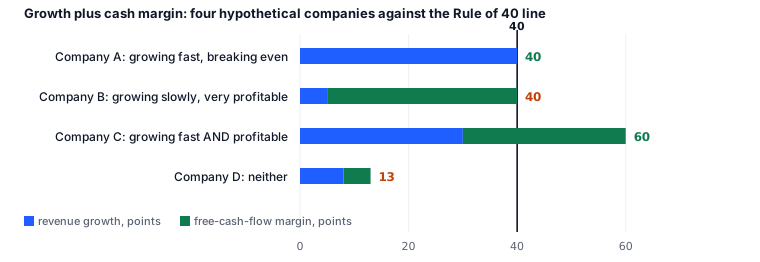
The Rule of 40 resolves the trade-off by adding the two: revenue growth plus free-cash-flow margin, both in percentage points. A company at 40% growth and 0% margin scores 40; so does one at 5% and 35%. Forty is the conventional bar for a software business that is earning its multiple. Historically that is where the sector's stronger companies have clustered.
On the board, growth is the trailing four filed quarters over the four before, and the FCF margin is trailing free cash flow over trailing revenue. Compute it for ServiceNow:
- Revenue growth: $14.73B over the prior year's $12.05B = +22%
- FCF margin: $4.58B of free cash flow ÷ $14.73B = 31%
- Rule of 40: 22 + 31 = 53
Thirteen points above the line. Now look at everyone at once:
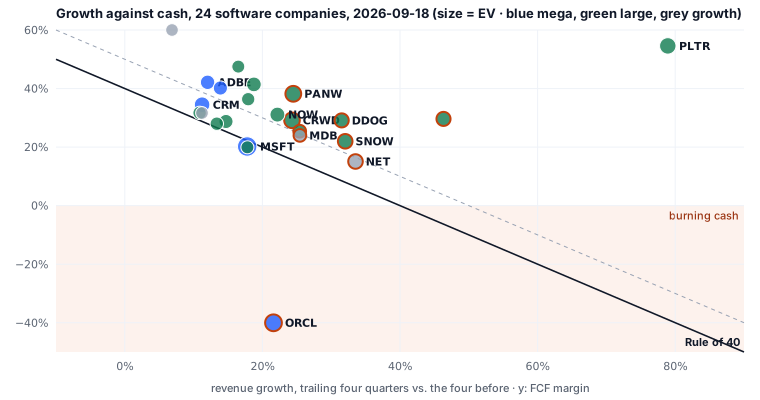
Two things the chart shows that a table would not. Most of the board clears 40, 21 of 24 on this day, which says the line is a low bar for the largest software companies. The board lets you move it to 50 for that reason. And the two that miss it are instructive. Microsoft scores 38: 18% growth with a 20% FCF margin, the margin held down by its AI data-center build-out. Oracle scores −18: 22% growth against a negative 40% FCF margin, for the same reason writ larger. Both are businesses that have chosen to spend cash faster than they earn it. The chart shows that choice where a P/E would hide it.
Try it: the switch above the chart moves the line to 30 or 50. Nothing else changes. Watch how many companies cross it, and notice how much the verdict "above the line" depends on where the line was drawn.
Step 3: Price it with enterprise value
To ask what you pay for a business, you need what the business is worth as a whole, shares and debt together. Software companies often hold billions in cash, and a few carry real debt; the market cap alone misprices both. Enterprise value fixes that:
EV = market cap + debt − cash and short-term investments
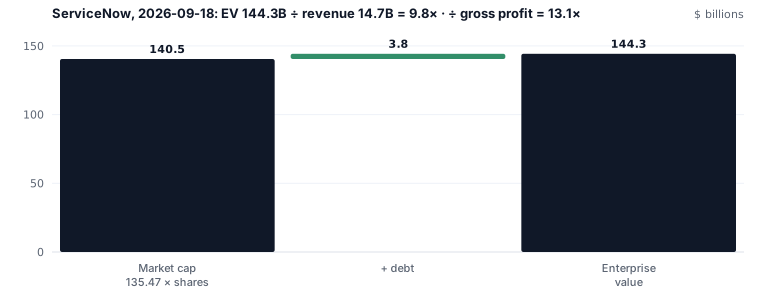
Then divide it by the number that is not distorted: EV / revenue = 9.8×. The board also shows EV / gross profit (13.1×), which is the fairer comparison between a 90%-margin business and a 65%-margin one, and EV / free cash flow (31×) where the cash flow is positive.
Why revenue and not earnings, once more: revenue is the one line that the stock-compensation and amortization choices do not touch. A 9.8× multiple of revenue is a real measurement. A P/E of 85 is a measurement of the accounting.
Step 4: Is 9.8× a lot? The same two comparisons
As with any multiple, 9.8× means nothing until you ask what it is buying. Two comparisons work.
Against growth. A multiple is a price for growth, so the board's second chart puts EV / revenue against revenue growth:
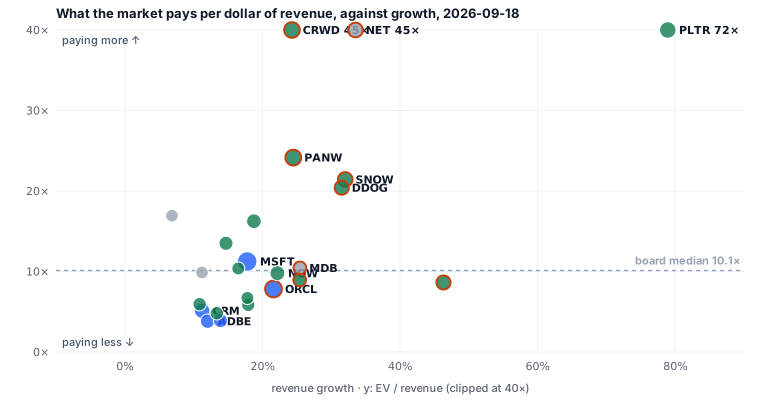
ServiceNow at 9.8× and 22% growth sits right at the board's median multiple, with growth a little above the median. Palantir at 72× revenue is the far corner: 79% growth, the fastest on the board, and a price that requires it to continue for years. Adobe at 3.8× with 12% growth is the opposite corner. The chart does not say which is right. It says what each price is paying for, so your next question can be specific: can Palantir keep growing at 79%, and why has Adobe's growth stalled?
Against its own history. Take each of the last twenty quarters, compute the enterprise value at that quarter's price and balance sheet, divide by that quarter's trailing revenue, and you have twenty readings of the multiple for the same company.
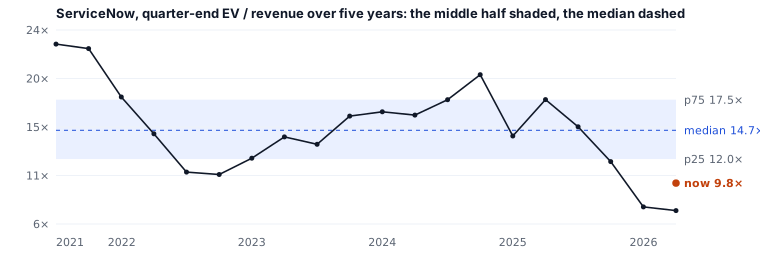
ServiceNow has averaged 14.7× revenue over five years; the middle half of quarters sit between 12.0× and 17.5×. Today's 9.8× is 33% below its own median. That is a strong sentence: whatever else is true, the market is paying less for a dollar of ServiceNow's revenue than it has in almost any quarter of the last five years, while growth has held at 21–22% throughout. The question that follows is the one worth an hour: what has changed, and is it the business or the mood.
Try it: sort the board by "vs. 5y median". Adobe is 61% below its own history; Fortinet is 57% above. Each card draws the five years.
Step 5: The part most screens skip: the cost of stock
Now the step that separates a careful reader from a screener. Software companies pay a large part of salaries in stock. The accounting rules put that stock on the income statement as an expense, which is why Step 1's operating margin was only 11%, and then add it back on the cash-flow statement, because no cash left the company. Free cash flow is therefore flattered by exactly the amount of pay that was settled in shares.
Follow ServiceNow's cash from the operating income line down:
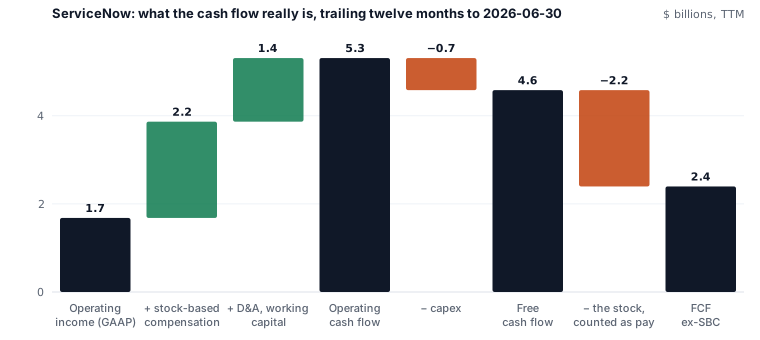
The $4.58B of free cash flow, the 31% margin that gave ServiceNow its Rule-of-40 score of 53, includes $2.19B that was paid to employees in shares. If those employees had been paid in cash, free cash flow would have been $2.40B, a 16% margin, and the Rule-of-40 score would be 38 instead of 53. Same company, same year.
Which margin is "right" depends on what you think the shares are worth to you. The stock was a real cost. It went to real people, and existing shareholders pay it through dilution while the company pays no cash. The honest position is to look at both numbers and know which one you are using. Across the board:
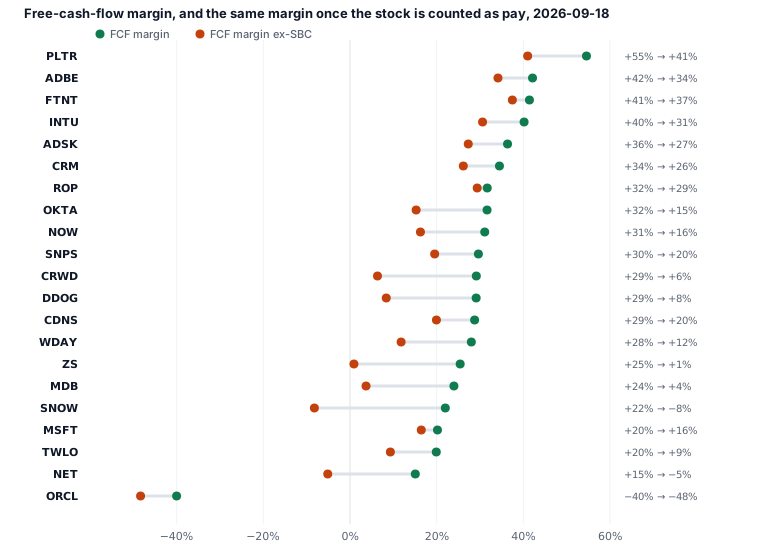
The median company on the board paid 11% of revenue in stock, and its 30% median FCF margin becomes 16% once that is counted. For some the gap is the whole story: CrowdStrike's 29% becomes 6% because it pays 23% of revenue in stock; Snowflake's 22% becomes −8% on 30%. A business that only generates cash because it pays its staff in paper is a business that would burn cash if it paid them in money.
The other place the stock shows up is the share count. If the company buys back as many shares as it issues, the dilution is neutralised, at a cash cost, which is the point. ServiceNow's diluted share count fell 0.9% over the year, because it spent $3.4B on buybacks, more than the stock it issued; Salesforce's fell 15%. Snowflake's rose 4.6%. The board's "Shares YoY" column is that number, buybacks netted.
Try it: every card's "What the cash flow really is" panel draws the waterfall above for that company. The table's "SBC / Rev" and "FCF ex-SBC" columns are the two dots.
Step 6: Three lights
Three things go wrong with software businesses often enough to deserve a light of their own. Each is on or off, with a fixed sentence when it is on; there is no combined score.
| Light | What it asks | On when |
|---|---|---|
| Dilution | Is the cash flow being paid for in shares? | SBC above 20% of revenue, or the share count up more than 5% in a year |
| Deceleration | Is growth slowing faster than the multiple has? | Growth more than 10 points below what it was a year earlier |
| Cash burn | Is the business self-funding? | Trailing free cash flow below zero |
On the 2026-09-18 board, eight companies had the dilution light on: CrowdStrike, Snowflake, Datadog, Zscaler, Cloudflare and MongoDB among them, all paying more than a fifth of revenue in stock. Oracle had the cash-burn light. None had the deceleration light: the sector's median growth had risen, from 15% to 18%, over the year.
A lit light is a reason to read the card. It settles nothing. Oracle's cash-burn light is a company spending far ahead of revenue on data centers, which is a choice its shareholders may or may not like; the light does not know that, and does not pretend to.
Step 7: Put it together: five minutes with any software company
Open a company's card on the board and go down this list.
- What scale is it? Mega (over $20B revenue), large, or growth (under $3B). The growth you should expect, and the multiple, both depend on it. Microsoft at 18% growth and a company at $1B revenue at 18% growth are different cases.
- Growth, FCF margin, Rule of 40. Above 40 with both parts positive is the shape you want. Above 40 because growth is 50% and the margin is negative is a different shape: it needs the growth to keep coming.
- EV / revenue against growth, and against its own five-year median. Far above its own history with growth slowing is the combination to worry about; below its own history with growth steady is the one to look into.
- Now take the stock out. SBC / revenue and FCF ex-SBC. If the ex-SBC margin is near zero or negative, Step 2's score was borrowed from the shareholders. Check the share count is not growing.
- Lights. Any light on is the first thing to explain.
- Read the data-quality notes. The provider's stock-compensation line is broken for some companies (Veeva and VeriSign on this board); the card leaves the SBC figures blank and says so instead of showing a wrong number.
What the board cannot tell you
- Net revenue retention. Whether existing customers spend more each year is the single best predictor of durable software growth. Companies disclose it in earnings decks and leave it out of the filings, so the board has no source for it.
- Remaining performance obligations (RPO). Contracted revenue not yet recognised tells you about next year's growth before it happens. Same problem.
- Where the growth comes from. Price increases, new customers, new products and acquisitions are all "revenue growth" on the statement and very different things underneath. Synopsys's 46% growth this year is mostly an acquisition; the card flags the share issuance that paid for it but cannot say more.
- Which SBC is which. Stock paid to a founder-CEO and stock paid to ten thousand engineers dilute identically and mean different things.
None of this is advice. A score above a line, or a multiple below a company's own median, describes two numbers on a given day. The board is there so that the next question you ask is the right one, and after this guide you know which one that is.
The weekly
The week's 13F filings, insider trades and earnings, plus new research on the site. One email a week, no account.
More posts
- Anthropic's $16.8B quarter: the investor day numbers
- What is a DCF? What a corner shop is worth
- How the 10-year Treasury moves every valuation on this site
- Delta vs United by the numbers
- Anthropic's IPO prospectus: the numbers behind the $42B loss
- Who actually owns this stock: how to read a 13F
- How to read a market sentiment gauge
- Market breadth: the index can rise while most stocks fall
- How we value a stock: twelve models, one number
- Where the numbers come from: filings, point in time
- Tesla, taken apart: a sum of the parts in three scenarios
- How to read a reverse DCF: the growth a stock price implies
- How to value a bank: P/TBV, ROTCE and the line
- How to value a REIT: FFO, P/FFO and the yield spread
- Total return vs price return: what a stock chart leaves out
- What a backtest cannot tell you