Alphabet Q3 2026: Cloud +103%, free cash flow −$9.1B
 Allen Yan · · 13 min read
Contents
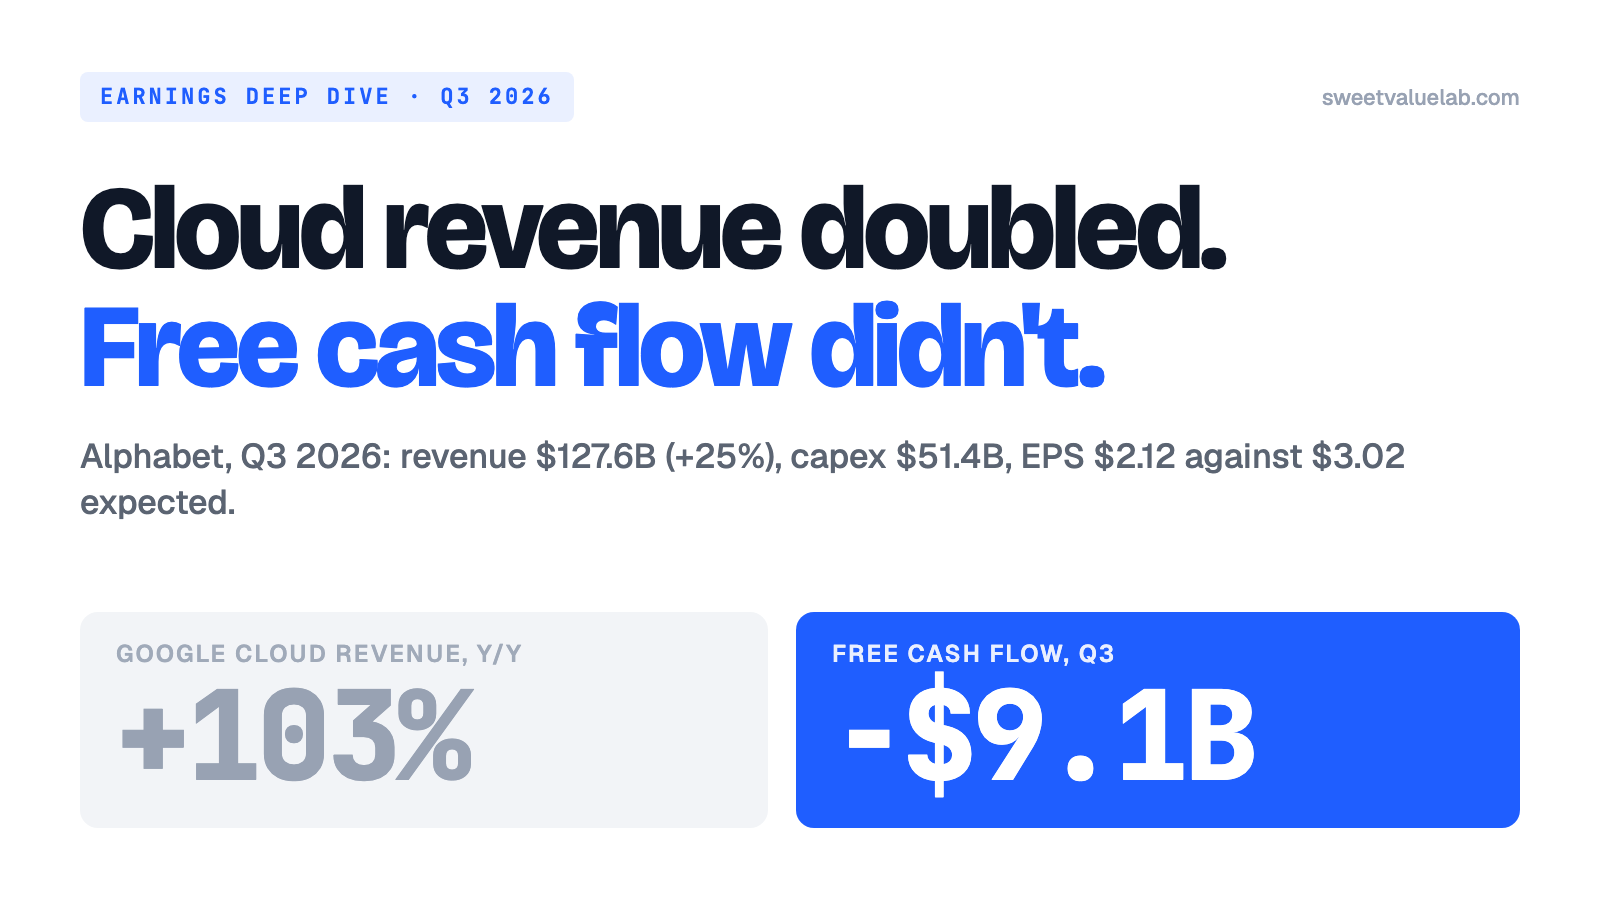
Alphabet reported its third quarter of 2026 after the close on October 28. Revenue rose 25% to $127.58 billion, Google Cloud's revenue more than doubled, and operating income rose 30%. Earnings per share were $2.12 against a $3.02 consensus. GOOGL closed the regular session at $324.89 and was quoted at $289.11 before the open on October 29, 11.0% lower.
In this post I take the quarter apart against two baselines (the third quarter of 2025 and the second quarter of 2026), separate what the business earned from a mark on an investment, and then put the capex guidance into our DCF, which has not caught up with it. Near the end I collect what investors on X made of it, because several of them read the same filing and came out in different places.
At a glance
- The EPS miss is mostly one mark. An $8.7 billion loss on equity securities cut EPS by $0.55. Without it, EPS would have been $2.67, still $0.35 short of $3.02.
- Search slowed. Google Search & other grew 12% to $63.35 billion, after 17% in the second quarter. Against the second quarter it was flat: $63.27 billion then.
- Cloud doubled at a 36.2% margin. Revenue $30.71 billion (+103%), operating income $11.12 billion, backlog $561 billion.
- Free cash flow was −$9.07 billion. Capex of $51.36 billion passed operating cash flow of $42.29 billion for the second quarter running.
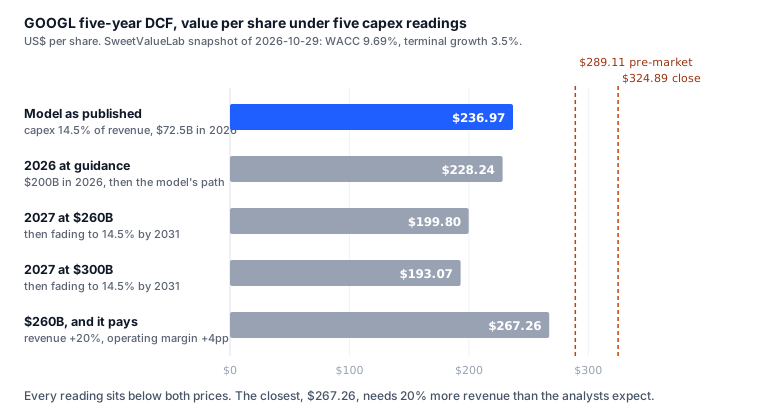
- Overvalued by 22% vs model. Our five-year DCF gives $236.97 a share against the $289.11 pre-market quote. Putting 2026 capex at the guided $200 billion takes the model to $228.24.
Q3 2026 in numbers, against last year and last quarter
From the Q3 2026 press release (8-K exhibit 99.1, filed October 28). Second-quarter figures are from the Q2 2026 release. Consensus is FMP's unless named. Fortune quoted S&P Global Visible Alpha's revenue consensus at $127.9 billion, and Investing.com had $127.22 billion, so "in line" depends on whose list you read.
Income statement
- Revenue +25% Y/Y to $127.58 billion ($0.38 billion below a $127.96 billion consensus; +6.5% Q/Q). Constant currency +25%.
- Operating income +30% Y/Y to $40.58 billion (−0.5% Q/Q, from $40.77 billion).
- Operating margin 31.8%, +1.3pp Y/Y and −2.2pp Q/Q.
- Other income −$8.22 billion, against +$12.76 billion a year ago and +$97.98 billion in the second quarter.
- Diluted EPS $2.12 against $3.02 consensus (−26% Y/Y from $2.87; $9.11 in the second quarter).
Segments
| Line | Q3 2026 | Y/Y | Q/Q |
|---|---|---|---|
| Google Search & other | $63.35B | +12.0% | +0.1% |
| YouTube ads | $11.21B | +9.2% | +1.4% |
| Google Network | $7.46B | +1.4% | +2.1% |
| Subscriptions, platforms, devices | $14.29B | +11.0% | +10.7% |
| Google Services, total | $96.30B | +10.6% | +1.9% |
| Google Cloud | $30.71B | +102.6% | +24.0% |
| Services operating margin | 40.7% | +2.2pp | −1.2pp |
| Cloud operating margin | 36.2% | +12.5pp | +0.6pp |
Cash flow and funding
- Operating cash flow −12.6% Y/Y to $42.29 billion (+8.2% Q/Q).
- Capex +114% Y/Y to $51.36 billion (+14.3% Q/Q).
- Free cash flow −$9.07 billion, against +$24.46 billion a year ago and −$5.86 billion last quarter. Trailing twelve months (TTM, the last four quarters summed): $19.75 billion.
- Buybacks zero, against $11.50 billion a year ago. Instead the company sold $12.37 billion of stock and $28.7 billion of notes.
Guidance
- 2026 capex unchanged at $195–205 billion. Nine months have used $131.95 billion, which leaves $63–73 billion for the fourth quarter.
- 2027 capex to "increase significantly", with figures on the fourth-quarter call.
How Alphabet makes money
Google Services is the old business: Search ads, YouTube ads, the Network that places ads on other sites, and subscriptions and hardware (YouTube Premium, Google One, Pixel). Google Cloud sells computing to companies, and since this year that includes TPU systems, racks of Google's own AI chips sold outright. Other Bets is mostly Waymo. One more line matters this quarter: "Alphabet-level activities", the shared AI research the company does not charge to any segment, which cost $7.66 billion.
The EPS miss: $0.55 a share from one investment mark
Alphabet books gains and losses on the shares it holds in other companies through other income, below operating income. In the second quarter that line added $99.0 billion of gains and $6.26 a share. In the third it subtracted $8.66 billion. The release's own footnote puts the after-tax cost at $6.7 billion of net income and $0.55 a share. Fortune tied the loss to the SpaceX stake.
Adding the $0.55 back gives $2.67. That leaves $0.35 that the mark does not explain, and most of it sits in operating income. Revenue rose $7.78 billion from the second quarter while operating income fell $0.19 billion. Three lines took the difference:
- Cost of revenues up $5.48 billion Q/Q to $51.42 billion. Depreciation of property and equipment was $8.37 billion, up 49% from a year ago.
- Alphabet-level activities up $1.87 billion Q/Q to $7.66 billion, 71% more than a year ago.
- Research and development up $2.42 billion Q/Q to $20.64 billion.
Two smaller items work in the same direction. Interest expense was $967 million against $143 million a year earlier, the cost of the new debt. And the diluted share count was 12,368 million, 1.4% more than a year ago, after the at-the-market sales.
Search: +12%, flat on the second quarter
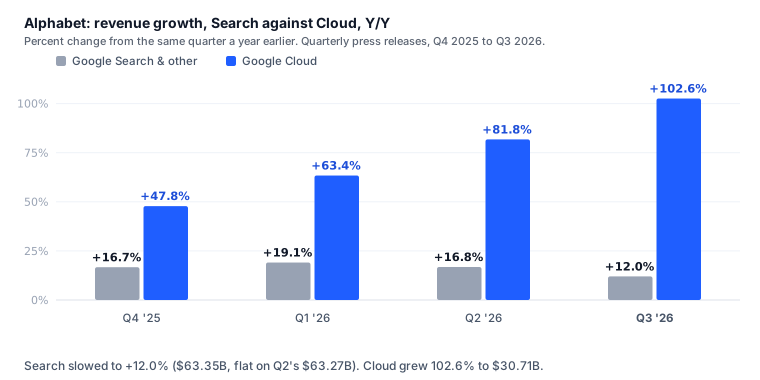
Search & other made $63.35 billion, $0.08 billion more than in the second quarter. Visible Alpha's consensus, as Fortune reported it, had expected 15% growth. The release says query growth was the highest in five years, so the slowdown came from money per query. Use kept growing.
Management gave four reasons on the call. Chief Business Officer Philipp Schindler named exchange rates first:
"It was the single largest driver of Search deceleration relative to Q2."
CFO Anat Ashkenazi added that Search had "started lapping the acceleration" of 2025. Schindler said advertisers' media spending "normalized after an unseasonably strong Q2", the World Cup quarter. The fourth reason is the one that does not wash out: AI Mode queries grew fast, with what Schindler called "lower monetization" than classic Search. He did not say how much lower.
YouTube ads grew 9% to $11.21 billion and the Network 1% to $7.46 billion, so nothing else in Services made up the gap. Services' operating margin was 40.7%, down from 41.8% in the second quarter.
Cloud: +103%, a 36.2% margin and a $561 billion backlog
Cloud revenue was $30.71 billion, up 24% from the second quarter alone. Operating income tripled from a year ago to $11.12 billion, a 36.2% margin against 23.7% then. Times four, the quarter is a $122.8 billion run rate.
The backlog was $561 billion, and Ashkenazi said "just over 55%" of it turns into revenue in the next 24 months. That is about $309 billion, or $154 billion a year, against $93.17 billion of Cloud revenue over the last four quarters. Two things are not sized. TPU system sales were "a meaningful contributor" with no dollar figure, and Thomas Kurian, Cloud's CEO, said the company does not break out product margins. And third-party compute capacity, rented to meet demand, came online at the end of September, so its cost lands in the fourth quarter. Ashkenazi:
"We expect margin headwinds in the near term as we utilize this capacity."
Free cash flow: −$9.1 billion after $51.4 billion of capex
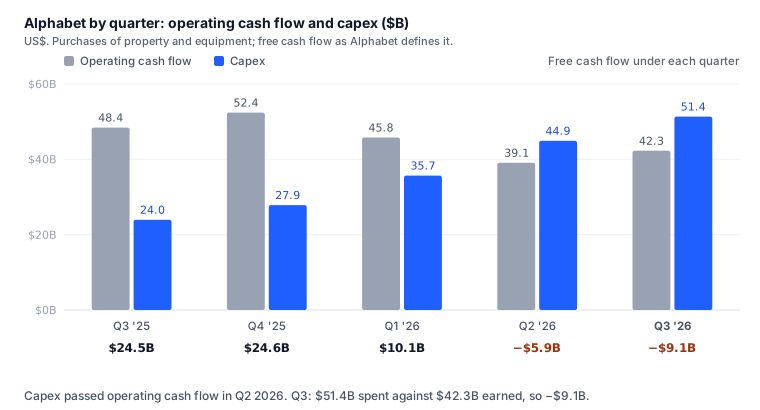
Capex doubled in a year. Operating cash flow went the other way, down 12.6%, for three reasons visible in the cash flow statement and the call: inventory rose $3.22 billion (TPU systems built against signed contracts), "other assets" absorbed $7.81 billion, and Ashkenazi named a $5.2 billion payment on a 2018 European Commission fine. Net income was also $8.5 billion lower than a year ago, though the mark that caused most of that is added back as a non-cash item.
The fine is a one-time payment. The fourth quarter's capex, implied by the full-year guidance at $63–73 billion, would be more than any quarter so far, and Ashkenazi put future purchase commitments at $924 billion.
Paying for it: no buybacks, new shares and $28.7 billion of notes
This is short because the release says it plainly. In the quarter Alphabet bought back no stock, issued 36 million shares through its at-the-market program for $12.37 billion, and raised $28.7 billion of senior notes. Long-term debt is $125.10 billion, against $46.55 billion at the end of 2025. Cash and marketable securities are $265.10 billion. The cash flow statement shows no repurchases at all in 2026, against $39.81 billion in the first nine months of 2025.
What capex does to our DCF: $236.97 as published, $193–$228 at guidance
Our headline for GOOGL is the five-year FCFF DCF, $236.97 a share on the snapshot of October 29, built on the October 28 close of $324.89. At that close the stock was overvalued by 37% vs model. At the $289.11 pre-market quote it is overvalued by 22% vs model.
The model takes revenue from the analysts' consensus: +23.9% in 2026, +25.1% in 2027, +21.4% in 2028. It takes the cost structure from fiscal 2025, an operating margin of 32.1%. And it takes capex as the last five years' capex over the last five years' revenue, 14.5%. That makes 2026 capex $72.5 billion and 2026 free cash flow to the firm $96.5 billion. The company has guided $195–205 billion of capex, and in the first nine months its free cash flow was −$4.8 billion.
The model has not seen any of this because it reads annual statements, and fiscal 2026 arrives with the 10-K in February. So I replaced the capex by hand and left everything else alone. Each extra dollar of capex leaves in the year it is spent; a fifth of it is depreciated in each of the next five years, which saves tax at the model's 16.2% rate. Per share:
Δ value = [ −Σ ΔCapex_t ÷ 1.0969^(t+0.5) + Σ Σ_k 0.162 × ΔCapex_t/5 ÷ 1.0969^(t+k+0.5) ] ÷ 12.23B shares
For 2026 alone: $200 billion less $72.47 billion is $127.53 billion of extra capex. Discounted half a year at the 9.69% WACC that is $121.77 billion out. The tax saved is 0.162 × $127.53 billion ÷ 5 = $4.13 billion a year for 2027–2031, worth $15.08 billion today. The net is −$106.69 billion, or −$8.72 a share, so the model becomes $228.24.
For 2027 the company gave no number. I used two: $260 billion (30% above 2026) and $300 billion (50% above), each fading in a straight line back to 14.5% of revenue by 2031. They give $199.80 and $193.07.
Two readings, with a number for each
The reading in which the spending pays. The backlog says some of it will. If the $260 billion path brings 20% more revenue than the consensus from 2027 on, and an operating margin 4 points higher (Cloud already earns 36.2% against the company's 32.1% base), the DCF gives $267.26. I chose those two numbers to be generous. They are still $21.85 below the pre-market quote. The other models on the stock page are higher: peer P/E $391.50 and Alphabet's own five-year P/E history $424.04, because they price earnings, and earnings are struck before capex and only slowly feel the depreciation.
The reading in which it does not. If AI Mode keeps taking queries at lower revenue per query, the revenue line in the model is too high, and the capex is spent anyway. The $300 billion path with the consensus revenue gives $193.07. The model has a cash-flow gate that a DCF must pass to lead the page (three years of free cash flow summing to more than zero). It passed on fiscal 2023–2025, $215.5 billion. Fiscal 2026, at −$4.8 billion for nine months, will weigh on that sum when it arrives.
Where it ends up depends on numbers the company has not published yet. The last section lists them.
Reactions on X: the operating line, Search and the cash
I read the most-shared posts under $GOOGL on X between the release and the next morning. They split along the same lines as the filing.
On the EPS headline, Nicholas Mugalli made the point about the mark on the evening of the release, and put the operating-income miss at about 6%:
"Most of the damage is below the operating line, where Alphabet books gains and losses on stakes it holds in other companies."
SasoEquity went through the four Search reasons one by one, and added a detail I had not weighed: the EU's end of its duty-free treatment for cheap parcels, which hit Asian retail advertisers. On the AI Mode part:
"The first three wash out over time. The fourth is structural: more usage on a surface that earns less per query."
Coin Bureau read the same numbers more bluntly, as Search being "CANNIBALIZED by AI", because "more searches don't automatically mean more money". Jim Cramer blamed the product line-up the next morning:
"Google's problems have a lot to do with a lack of discipline and a lack of differentiation between Gemini and Google classic."
On the cash, zerohedge compared it with what analysts expected: free cash flow "-$9.1bn vs -$3.5bn consensus", with TTM free cash flow down 73% from $73.6 billion a year earlier. Their capex estimate was $55.8 billion, so the spending came in lower than expected and the cash still missed, because operating cash flow fell short.
The bulls led with Cloud. Shay Boloor:
"Google Cloud could surpass a $120B ARR while growing over 100% and $GOOGL would still sell off after earnings at ~20x earnings."
His arithmetic checks out: $30.71 billion times four is $122.8 billion, and $289.11 is 18.8 times the $15.35 consensus EPS for 2027. Fran Castro, writing in Spanish, pointed out that double-digit revenue growth "is not common" at this size and that Cloud doubled at a 36% operating margin (my translation).
None of the posts I read put the capex into a valuation; the DCF section above does that.
The stock on earnings days
GOOGL fell 7.1% the day after the second-quarter report, from $342.09 on July 22 to $317.69, and recovered to $377.65 by August 4. The pre-market quote of $289.11 is 29% below the 52-week high of $408.61.
What would change these numbers
- AI Mode revenue per query. Management has not given it. Search & other above 15% growth in the first half of 2027, once the 2025 comparison and the World Cup are out of the way, would say the gap is closing. Below 10% would say the fourth reason is the main one.
- The 2027 capex number on the fourth-quarter call. At $260 billion the DCF is about $200; every further $40 billion takes roughly $7 a share off it.
- Cloud margin after the rented capacity. A fourth-quarter Cloud margin under 33% would mean the third-party compute costs more than the backlog's pricing covers.
- The fiscal 2026 10-K. When it lands, the model's capex window becomes 2022–2026 and its capex intensity moves from 14.5% to about 22% on its own, and the cash-flow gate counts a weak year.
Takeaway
The operating business grew revenue 25% and operating income 30%, and Cloud tripled its profit. The quarter's cash went into $51.4 billion of servers, buildings and chips, and the company borrowed and sold stock to cover the gap. How much revenue per query will AI Mode earn by the time the 2027 capex is spent?
Sources and data
- Alphabet, Q3 2026 press release (8-K exhibit 99.1), October 28, 2026: income statement, segments, cash flow, other income footnote, free cash flow reconciliation, at-the-market program and notes.
- Alphabet, Q2 2026 press release, July 22, 2026; Q1 2026 press release; Q4 2025 press release: the quarterly series in the two charts.
- The Motley Fool, Alphabet Q3 2026 earnings call transcript, October 29, 2026: capex guidance, backlog, Search drivers, EC fine, third-party compute, TPU customers.
- Investing.com, Q3 2026 earnings call transcript, October 28, 2026: EPS and revenue consensus.
- Fortune, Alphabet's Google Cloud revenue doubles to $31 billion as cash flow stays deep red, October 28, 2026: Visible Alpha revenue and Search consensus, the SpaceX stake.
- FMP: EPS ($3.02) and revenue ($127.96 billion) consensus, 2027 EPS consensus ($15.35), GOOGL closes, and the pre-market quote (bid $289.03, ask $289.19, 7:33 a.m. ET, October 29).
- Posts on X, October 28–29, 2026, linked where quoted: Nicholas Mugalli, SasoEquity, Coin Bureau, Jim Cramer, zerohedge, Shay Boloor, Fran Castro.
- SweetValueLab, GOOGL stock page and DCF model page, snapshot of October 29, 2026 (price as of the October 28 close). The capex readings are my arithmetic on that snapshot's projections, as shown above.
The weekly
The week's 13F filings, insider trades and earnings, plus new research on the site. One email a week, no account.
More posts
- GE Vernova Q3 2026: $29B of orders, paid for in advance
- SoFi Q3 2026: revenue +44%, a $0.90 EPS outlook for 2027
- Coca-Cola Q3 2026: volume +5%, EPS guidance raised to 11%
- Anthropic's S-1: a $974 million operating profit in Q2 2026
- Tesla–SpaceX merger: the exchange ratio, valued part by part
- SpaceX Q3 2026: revenue +161%, the valuation moves $2
- Why do stocks fall after beating earnings?
- Why Goldman, Citi, J&J and ASML stocks fell after earnings
- Anthropic's $16.8B quarter: the investor day numbers
- What is a DCF? What a corner shop is worth
- How the 10-year Treasury moves every valuation on this site
- Delta vs United by the numbers
- Anthropic's IPO prospectus: the numbers behind the $42B loss
- Who actually owns this stock: how to read a 13F
- How to read a market sentiment gauge
- Market breadth: the index can rise while most stocks fall
- How we value a stock: twelve models, one number
- Where the numbers come from: filings, point in time
- Tesla, taken apart: a sum of the parts in three scenarios
- How to read a reverse DCF: the growth a stock price implies
- How to value a bank: P/TBV, ROTCE and the line
- How to value a REIT: FFO, P/FFO and the yield spread
- How to value a software company: Rule of 40 and SBC
- Total return vs price return: what a stock chart leaves out
- What a backtest cannot tell you