Total return vs price return: what a stock chart leaves out
 Allen Yan · · 3 min read
Contents
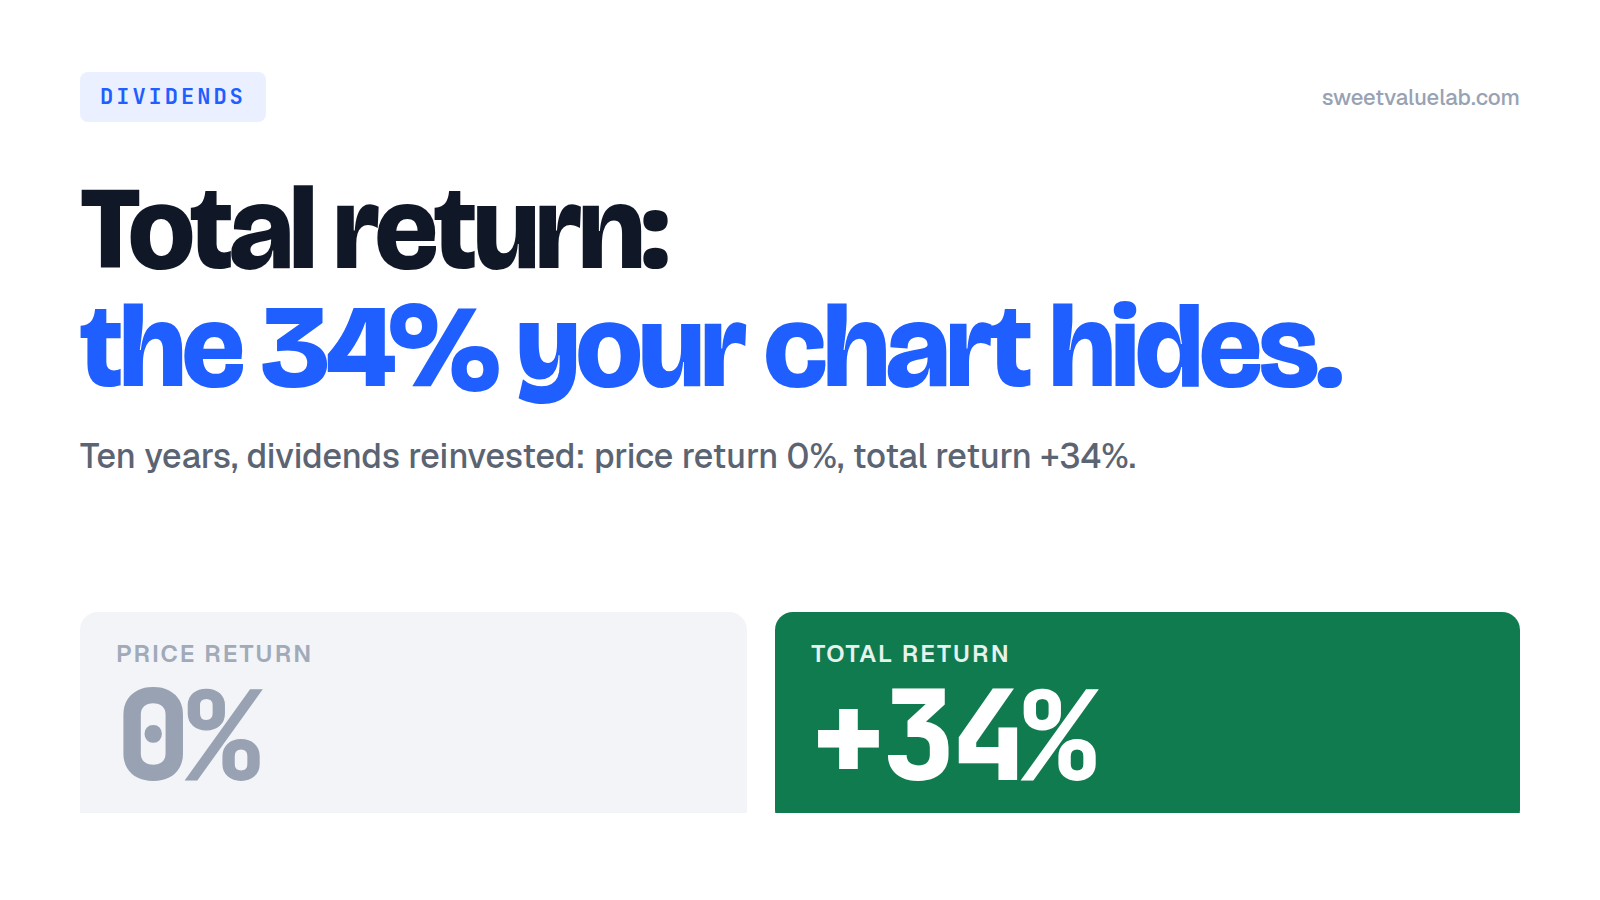
Pull up almost any stock chart and you are looking at price return: where the last trade printed. That is all it shows. It is the number every app displays by default, and for a company that has never paid a dividend it is the whole story.
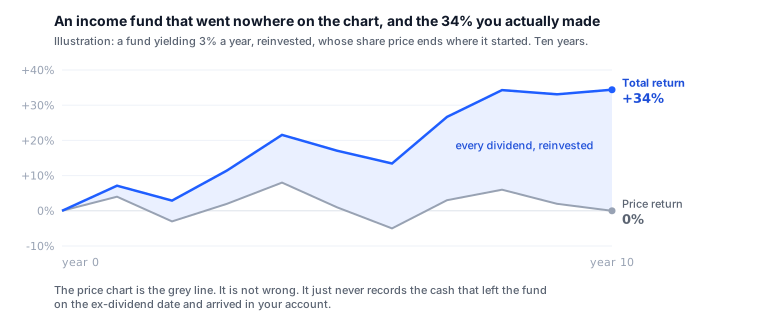
Anything that pays you along the way works differently. A fund yielding three percent hands you three percent of your money each year, and its price drops by roughly that amount on the ex-dividend date. The cash left the fund. The chart records the exit and never records the arrival in your account. Do that for ten years and the chart is missing about a third of what you actually earned.
The two numbers
Price return answers: what is one share worth now versus then?
Total return answers: what is my money worth now versus then, if every dividend went back into more shares?
The second question is the one you were actually asking. It is also the one that makes assets comparable. Otherwise you are holding a growth fund's full result against an income fund's partial one and calling the growth fund a winner.
Where the gap is large enough to change a decision
The gap is spread very unevenly across asset types:
- High-yield equity funds and REITs. Most of the return arrives as cash. Judge these on price and you will conclude they are dead money, which is backwards.
- Broad market index funds. A couple of percent a year, compounding. Over twenty years that is a large multiple.
- Growth and non-payers. Almost no gap. Price return and total return say close to the same thing.
That last case is why the mistake survives. For the assets people talk about most, the two numbers nearly agree, so nobody learns to ask which one they are looking at.
Reinvested and spent
Total return normally assumes every dividend buys more shares. That is an assumption. It may have nothing to do with your life: if you are living off the income, you got the cash and did not get the compounding, and your result sits somewhere between the two lines.
Both are worth seeing side by side, so our portfolio backtest computes them together: the same holdings, dividends reinvested and dividends taken as cash, on daily split-adjusted prices. SCHD on its own shows the gap on a fund built for income. SCHD vs VYM shows that two funds with similar yields can still separate on total return, because yield is one thing and return is another.
What to check before you trust a comparison
- Is it total return? If the source does not say, assume price and treat the income fund's number as understated.
- Reinvested or paid out? Both are legitimate. They answer different questions.
- Same window for everything? A fund that launched in 2020 cannot be compared over twenty years, and quietly starting its line later flatters or damns it depending on what 2020 to 2022 did.
- Gross or net? Backtests here are gross: no dividend withholding tax, no commissions. Your taxable account will do worse, and by an amount that depends on where you live.
None of this makes dividends magic. A dollar paid out is a dollar no longer in the share price, and the case for an income strategy is behavioural or structural. But you cannot make that judgement at all while the chart you are reading is quietly leaving out the cash.
Start from the ready-made dividend basket, or type in the tickers you actually hold.
The weekly
The week's 13F filings, insider trades and earnings, plus new research on the site. One email a week, no account.
More posts
- Anthropic's $16.8B quarter: the investor day numbers
- What is a DCF? What a corner shop is worth
- How the 10-year Treasury moves every valuation on this site
- Delta vs United by the numbers
- Anthropic's IPO prospectus: the numbers behind the $42B loss
- Who actually owns this stock: how to read a 13F
- How to read a market sentiment gauge
- Market breadth: the index can rise while most stocks fall
- How we value a stock: twelve models, one number
- Where the numbers come from: filings, point in time
- Tesla, taken apart: a sum of the parts in three scenarios
- How to read a reverse DCF: the growth a stock price implies
- How to value a bank: P/TBV, ROTCE and the line
- How to value a REIT: FFO, P/FFO and the yield spread
- How to value a software company: Rule of 40 and SBC
- What a backtest cannot tell you