How to value a bank: P/TBV, ROTCE and the line
 Allen Yan · · 11 min read
Contents
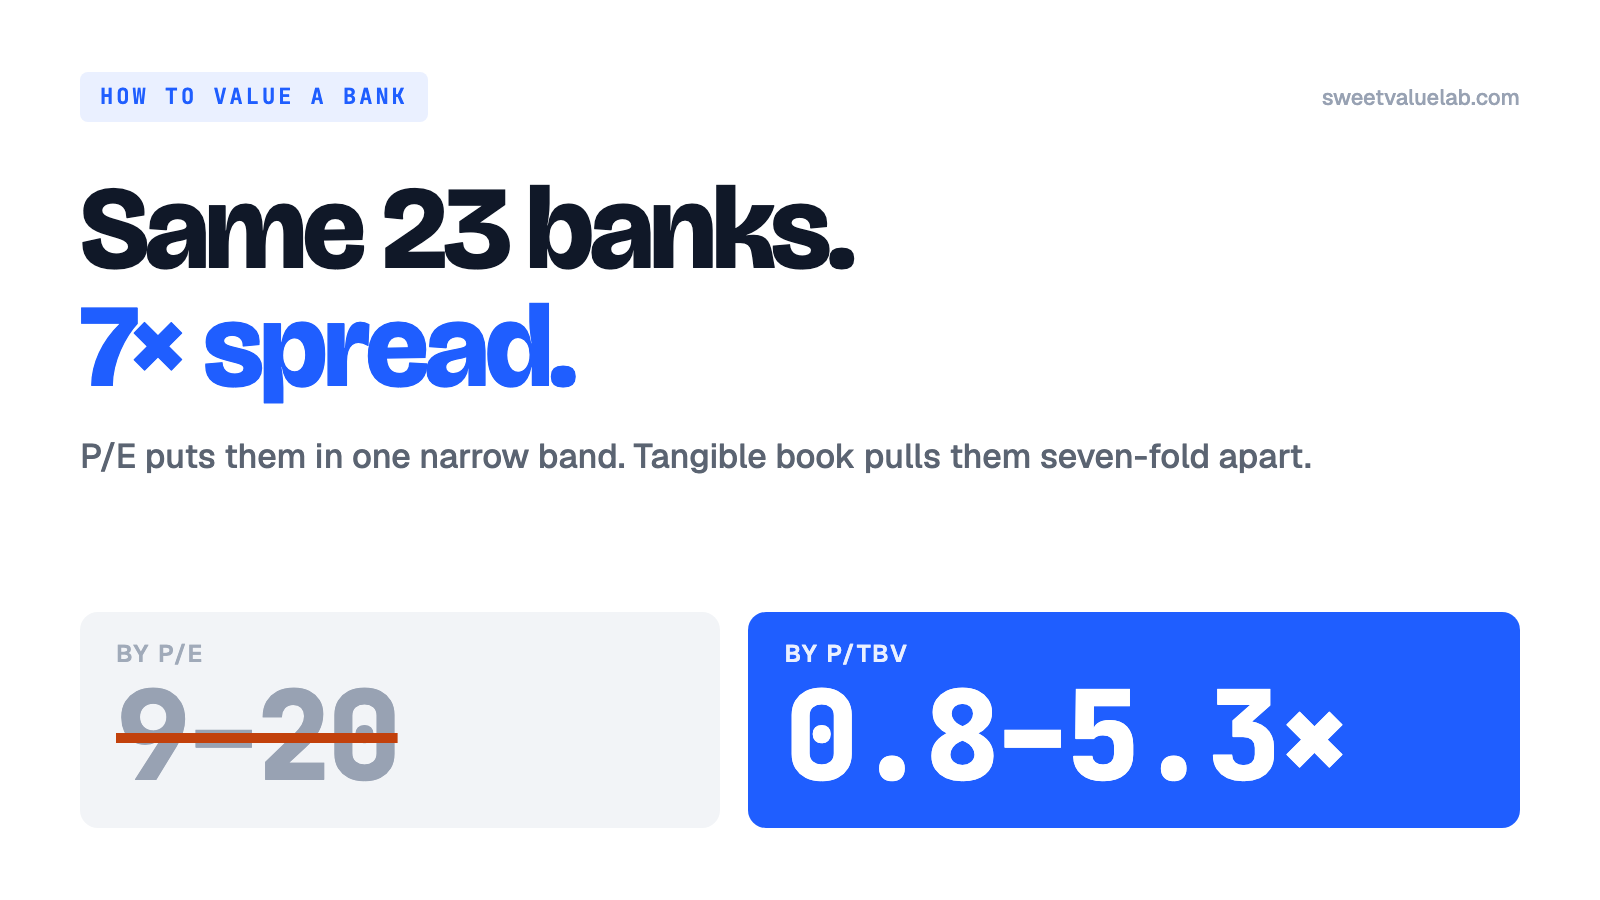
Pull up the largest US banks on a screener and sort by P/E. You get a tidy column between 9 and 20: JPMorgan at 15, Bank of America at 13, Citigroup at 14, Zions at 8. It looks like a sector priced within a narrow band, with a few bargains at the bottom.
Now sort the same banks by price to tangible book. The column runs from 0.76× to 5.27×. That is a seven-fold spread, on the same day, for companies whose P/Es were all within a few points of each other. One of those two columns is telling you almost nothing, and it is the one you looked at first.
This guide walks through why, one step at a time, and ends with a way to read any bank in about five minutes. It uses JPMorgan (JPM) on the 2026-09-18 close throughout; every figure comes straight off the bank board, so you can follow along on JPM's card and then do the same for any other name. The REIT and software guides follow the same shape if you have read them: find the number the industry actually runs on, price it, then ask what could break it.
Step 1: Understand what a bank is before you value it
A bank takes deposits and lends them out, keeping the difference. That sentence hides the thing that makes bank accounts unlike any other company's: the deposits are the raw material and the debt at the same time. A manufacturer borrows money to buy machines; a bank's borrowing is its inventory. So the ordinary tools fail in the first step:
- There is no free cash flow to discount. "Cash from operations" at a bank is mostly customers moving money in and out. It measures deposit flows.
- There is no enterprise value. Adding debt to market cap makes sense when debt funds the business from outside. At a bank, the "debt" is the business.
- The earnings are chosen. Every quarter, management decides how much to set aside for loans that might go bad. That provision comes straight out of net income, and it is an estimate. Two banks with the same loan book can report very different earnings depending on how conservative they feel this quarter.
What a bank does have is a balance sheet that everything else hangs off, and one thin slice of it that belongs to shareholders.
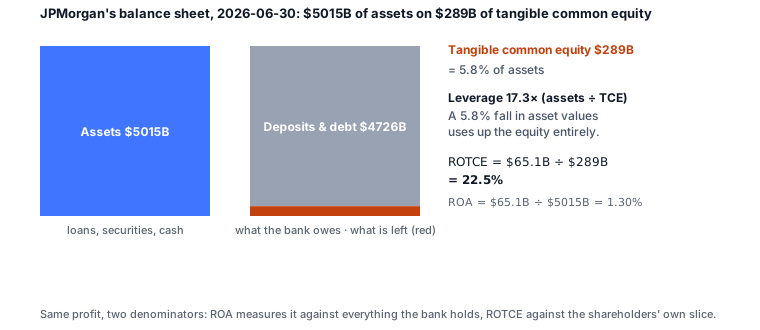
Hold onto that picture. The shareholder owns the red slice. Everything in this guide is about what the market pays for that slice and what the slice earns.
Step 2: Start from tangible equity
A bank's book value is its assets minus its liabilities. Two adjustments turn it into the number that matters:
- Take out goodwill and intangibles. They are the premium paid in past acquisitions. They cannot absorb a loan loss; when things go wrong, only tangible capital stands between the depositors and the hole.
- Take out preferred stock. It ranks ahead of common shareholders, so it is not theirs.
What remains is tangible common equity (TCE). Divide it by the diluted share count and you have tangible book value per share (TBVPS). Divide the share price by that and you have P/TBV, the multiple of tangible book the market is paying. Do it for JPMorgan:
- TCE = $289.3 billion; diluted shares ≈ 2.79 billion → TBVPS $103.54
- Price $349.67 ÷ $103.54 = P/TBV 3.38×
That is the first of the two numbers. On its own it means almost nothing. A bank at 1.2× tangible book is not a bargain and one at 3× is not overpriced, because a multiple of book is only worth what the book earns. Which is Step 3.
Step 3: What the equity earns: ROTCE
Take the bank's trailing-twelve-month net income and divide it by TCE. That is return on tangible common equity (ROTCE): the bank's profitability from the shareholder's seat. Before dividing, it is worth seeing where the net income comes from, because the shape of a bank's income statement is most of what you need to know about it:
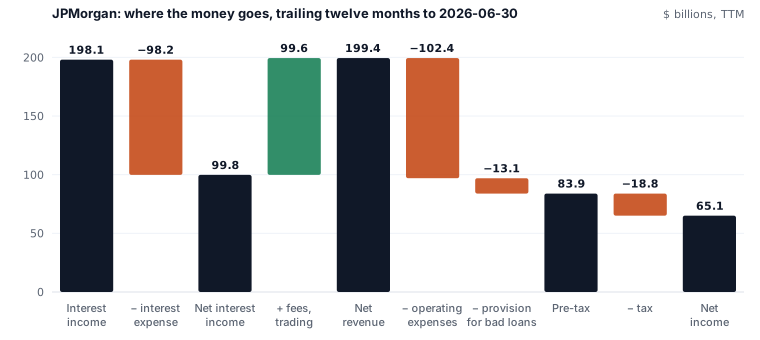
Two things to read off it. JPMorgan makes half its revenue from the spread (net interest income) and half from fees and trading. That is the "NII share" on the board, and it will matter in Step 6. And the provision, $13 billion, is 6.6% of net revenue: the number management chose, and the number that would move first if the economy turned.
Now the division: $65.1B ÷ $289.3B = ROTCE 22.5%.
Here is why ROTCE is the number to hold next to P/TBV. If a bank earns 20% on its tangible equity and you can buy that equity at book, you are buying a 20% return. Investors do not need 20% for bank risk; they want something like 10%. So they bid the price up until the yield measured on the price is around 10%, which means paying about 2× book. A bank earning 8% on equity gets no such bid: at book it yields 8%, below what the risk demands, so it trades under book.
Two banks with the same P/TBV and different ROTCE are different bets. That is why the board's central chart plots one against the other:
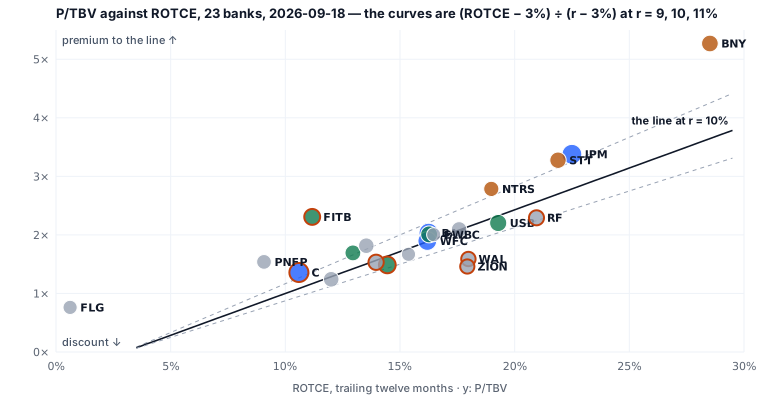
The seven-fold spread in P/TBV from the introduction is now explained: it is roughly the spread in ROTCE. Flagstar at 0.76× earns 0.6% on its equity; BNY at 5.27× earns 28.5%. The P/E column hid all of this because a P/E divides by the chosen, provisioned, after-the-fact earnings and never looks at the balance sheet those earnings came from.
Try it: the board's table has P/TBV and ROTCE side by side; the head of every card shows the close, P/TBV and TBVPS. Sort the table by ROTCE and watch P/TBV mostly follow it.
Step 4: The line: what a given ROTCE is worth
Write the logic of Step 3 down as a formula and you get the multiple a given ROTCE justifies:
P/TBV = (ROTCE − g) ÷ (r − g)
where r is the return investors demand on bank equity and g the growth the bank can sustain in perpetuity. The board fixes g at 3% and lets r switch between 9%, 10% and 11%. Three defensible costs of equity instead of one, so every bank gets a range of justified multiples, drawn as the curves on the chart above and as a band on each bank's page.
For JPMorgan at r = 10%: (0.225 − 0.03) ÷ (0.10 − 0.03) = 2.78×. The market paid 3.38×, a 21% premium to the line.

Two things the word "premium" does not mean. It is no kind of verdict: the market may be paying up for a franchise it considers more durable than the sector's, for lower risk, or for growth above 3%, none of which the formula can see. It is no kind of forecast either. The line moves when ROTCE moves, and a bank whose profitability falls will see its justified multiple fall with it. A premium or a discount describes two numbers on a given day, and the board keeps it at that.
The line also produces the board's most interesting reading in the other direction. Zions earns 17.9% on tangible equity, which puts its line at 2.13×, and it trades at 1.46×. That is a 31% discount. Something is holding the price below what the return justifies. Step 6 will show what.
Try it: the switch on the board moves r between 9, 10 and 11%; the "vs. line" column recomputes for every bank. Sort by "discount first" and ask, for each, what the market knows that the formula does not.
Step 5: Against its own history
The line compares a bank with a formula. The other comparison that works is against the bank's own past: for each of the last twenty quarters, the quarter-end price over that quarter's own TBVPS. That gives twenty readings of the multiple for the same bank, a median and a middle half.
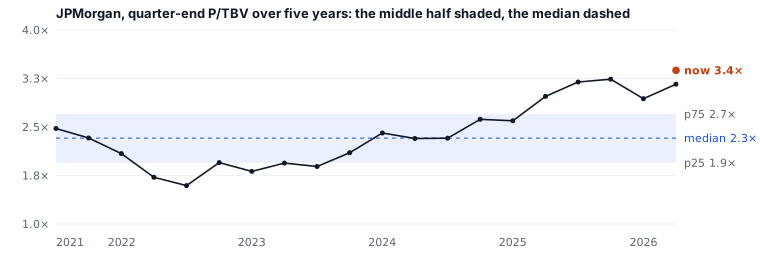
JPMorgan has averaged 2.33× tangible book over five years, with the middle half of quarters between 1.95× and 2.70×. Today's 3.38× is 45% above its own median and the highest reading in the window. Put that beside the 21% premium to the line from Step 4 and the two say the same thing in different ways: the market is paying more for JPMorgan's equity than it has at any point in five years, and more than its current return alone accounts for. Whether that is the franchise, the rate cycle or something else is the question to take to the card.
BNY makes the point more sharply: 5.27× against a five-year median of 2.64×, double its own history, on a ROTCE that has risen to 28.5%. A multiple far above a bank's history with a return that has risen to match is one story; the same multiple with a flat return is another.
Try it: the "vs. 5y median" column on the board, and the "Where it has traded" panel on every card.
Step 6: Is the equity real? Eight numbers and three lights
P/TBV against ROTCE answers "what am I paying for what it earns". It does not answer whether the book is what it says, or whether next year's earnings will look like last year's. That takes a short list of numbers that bank readers watch and generalist screens do not show. The board keeps eight, and colours each against thresholds printed on the page:
| # | Number | What it asks | Green / amber / red |
|---|---|---|---|
| 1 | ROTCE | What the equity earns | ≥18% / 12–18% / <12% |
| 2 | P/TBV | What the market pays for it | not coloured; read against the line |
| 3 | Efficiency ratio | Operating expenses as a share of net revenue: how much of each dollar the bank keeps | ≤55% / 55–62% / >62% (custody banks +10) |
| 4 | CET1 | Regulatory capital above its requirement: room to absorb losses, pay dividends, buy back | ≥200bp / 100–200bp / <100bp above requirement |
| 5 | NII / assets | Net interest income over total assets, an approximation of margin | shown, not coloured |
| 6 | Credit cost | Provisions as a share of net revenue: how much of the top line is going to bad loans | ≤5% / 5–8% / >8% |
| 7 | NII share | How much of revenue is spread income: sensitivity to rates | labelled high / medium / low |
| 8 | AOCI / TCE | Unrealized bond losses as a share of tangible equity | ≥−5% / −5 to −15% / <−15% |
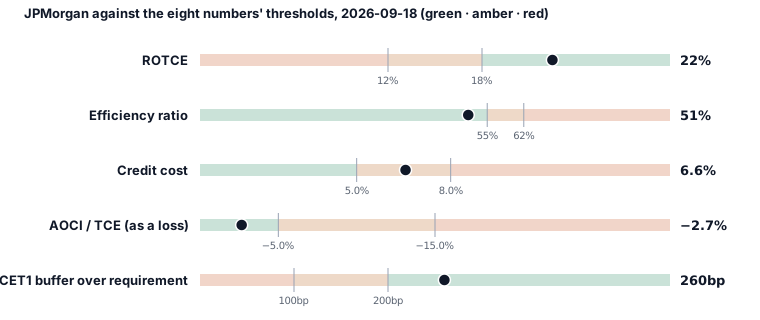
The eighth number deserves a paragraph, because it is the one that most explains why some banks trade at a discount to their line. When interest rates rise, the bonds a bank bought at lower yields lose market value. Under the accounting rules those losses sit in accumulated other comprehensive income (AOCI) and reduce equity without touching earnings. A bank with AOCI at −25% of tangible equity has a quarter of its capital tied up in paper losses that only unwind as the bonds mature, or crystallize if it ever has to sell. ROTCE looks fine. The equity underneath it is thinner than it appears.
That is Zions' story from Step 4: AOCI at −28.6% of tangible equity. The 31% discount to the line is the market pricing a book that is a quarter smaller than the accounts say. Citigroup carries −23%. JPMorgan, −2.7%.
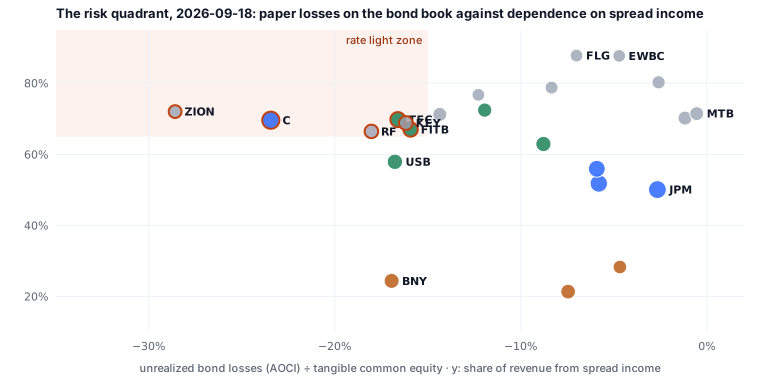
The board turns three of these into lights, each on or off with a fixed sentence when on:
- Rate. AOCI/TCE below −15% and spread income at least 65% of revenue. Six banks on this day, all in the shaded corner above.
- Credit. provisions above 8% of net revenue, or rising more than 20% two quarters in a row. Citigroup at 10.9% and Western Alliance at 12.6%.
- Capital. CET1 less than 100 basis points above its requirement. None on this day; JPMorgan sits 260bp above.
The colours are there for reading. Nothing on the board is sorted by them, and there is no combined score, because a score would be a grade wearing a disguise. A lit light is a reason to open the card, and the card says in one sentence why it is on.
One caveat that matters. CET1 and its requirement are not in the quarterly statements; the board carries them by hand from each bank's own disclosures, and leaves them blank instead of estimating when they have not been read from one. The card says when they were last updated.
Step 7: Put it together: five minutes with any bank
Open a bank's card on the board and go down this list.
- What tier is it? Money center, super-regional, regional, custody. Custody banks earn fees where the others earn spread, so their efficiency ratio runs higher and their AOCI matters less. Compare within a tier first.
- P/TBV and ROTCE, together. Never one without the other. Then the gap to the line at r = 10%: premium or discount, and how large.
- Against its own five years. Above or below its own median, by how much. A premium to the line and far above its own history is a bank the market has re-rated; ask why.
- AOCI / TCE. If it is beyond −15%, the book is smaller than it looks and a discount to the line may be exactly right. Check NII share alongside it. A spread-dependent bank with bond losses is the rate-light case.
- Credit cost, and the provision trend. The number management chose. Rising two quarters in a row is the credit light; the "Quarter by quarter" sparklines show it.
- Efficiency and CET1. Whether the bank keeps what it earns, and whether the regulator will let it hand that to you.
- Read the data-quality notes. A dropped quarter, an annualized window, a blank CET1: the card says what it did.
That is the method. It takes longer to read than to do.
What the board cannot tell you
- Net interest margin properly measured. NII over assets is a proxy; the real margin uses average earning assets, which the filings summarise away.
- Deposit quality. How much of the deposit base is non-interest-bearing, and how much is uninsured, decides what happens in a run. The board has a field for it, hand-maintained and often blank.
- What is in the loan book. Commercial real estate, office, consumer cards. The credit-cost number tells you provisions are rising without saying where.
- The stress test. The Fed's annual result sets the capital buffer inside the CET1 requirement; the board carries that requirement and nothing from the test itself.
None of this is advice. A premium or discount to the line, a multiple above a bank's own history, a light that is on: each describes two numbers on a given day. The board is there so that the next question you ask is the right one, and after this guide you know which one that is.
The weekly
The week's 13F filings, insider trades and earnings, plus new research on the site. One email a week, no account.
More posts
- Anthropic's $16.8B quarter: the investor day numbers
- What is a DCF? What a corner shop is worth
- How the 10-year Treasury moves every valuation on this site
- Delta vs United by the numbers
- Anthropic's IPO prospectus: the numbers behind the $42B loss
- Who actually owns this stock: how to read a 13F
- How to read a market sentiment gauge
- Market breadth: the index can rise while most stocks fall
- How we value a stock: twelve models, one number
- Where the numbers come from: filings, point in time
- Tesla, taken apart: a sum of the parts in three scenarios
- How to read a reverse DCF: the growth a stock price implies
- How to value a REIT: FFO, P/FFO and the yield spread
- How to value a software company: Rule of 40 and SBC
- Total return vs price return: what a stock chart leaves out
- What a backtest cannot tell you