 Allen Yan · · 10 min read
Anthropic's $16.8B quarter: the investor day numbers
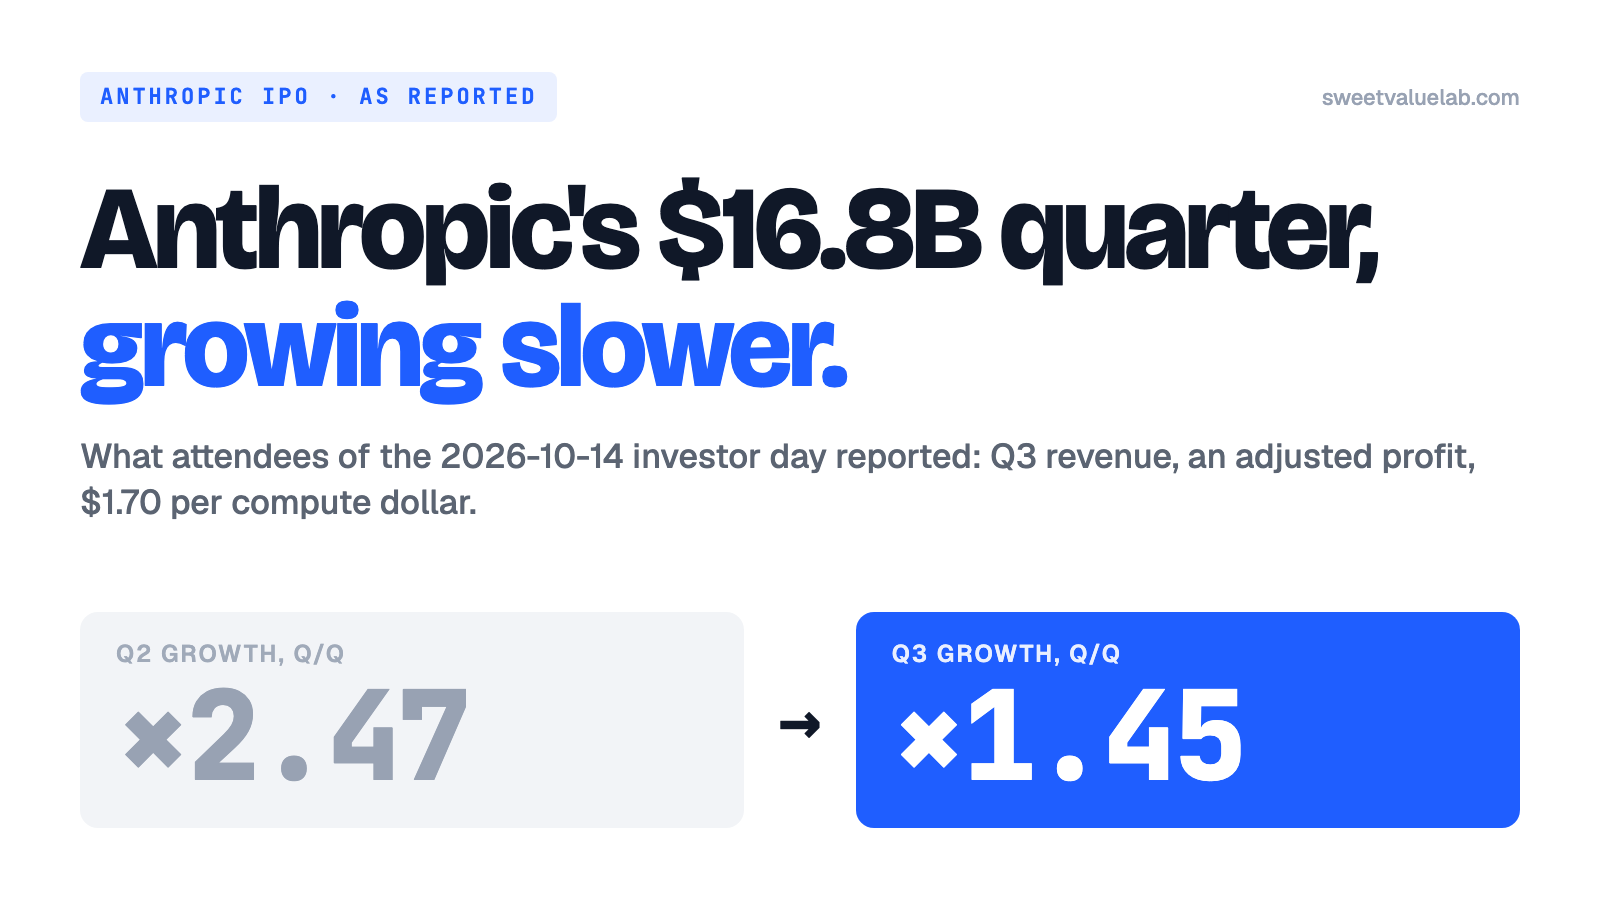
What attendees of Anthropic's October 14 investor day reported: Q3 revenue of $16.8B, an 11% adjusted margin, $1.70 per compute dollar, a slower pace.
Read →Notes on measuring investments honestly — what the standard numbers include, what they leave out, and how to check a claim against primary data instead of taking it on trust.
Allen Yan · · 10 min read
What attendees of Anthropic's October 14 investor day reported: Q3 revenue of $16.8B, an 11% adjusted margin, $1.70 per compute dollar, a slower pace.
Read →Allen Yan · · 11 min read
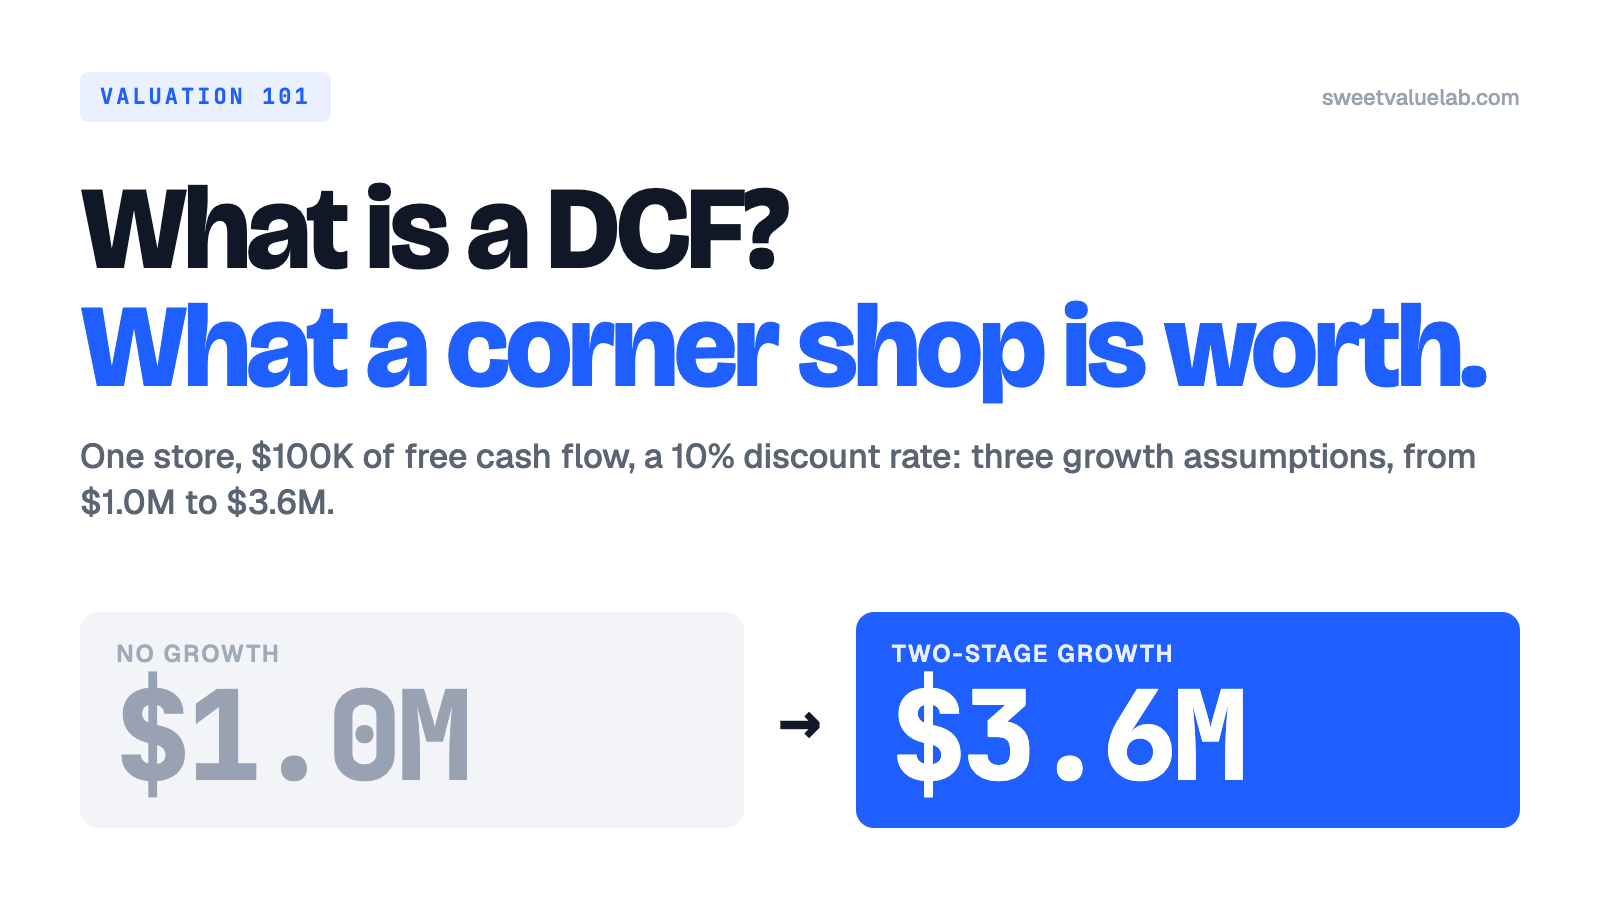
One fictional convenience store, valued step by step with a discounted cash flow: three growth assumptions take it from $1,000K to $3,582K.
Read →Allen Yan · · 6 min read
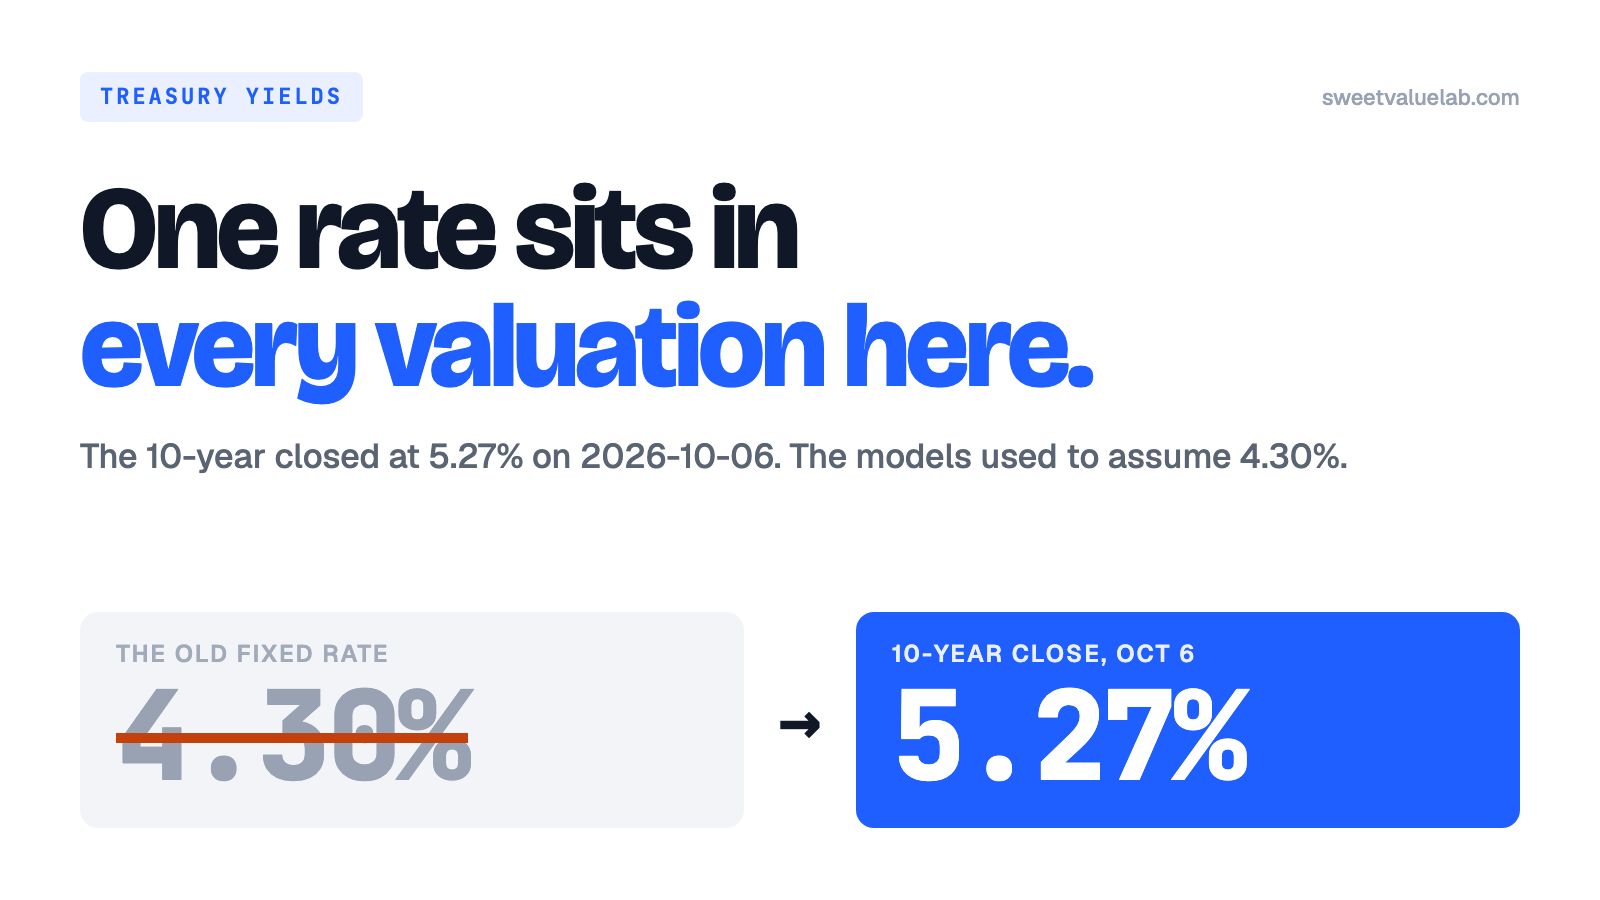
Every DCF here discounts at the latest 10-year Treasury close. What 98 bp did to model values, what moved the rate, and what the curve's past says.
Read →Allen Yan · · 4 min read
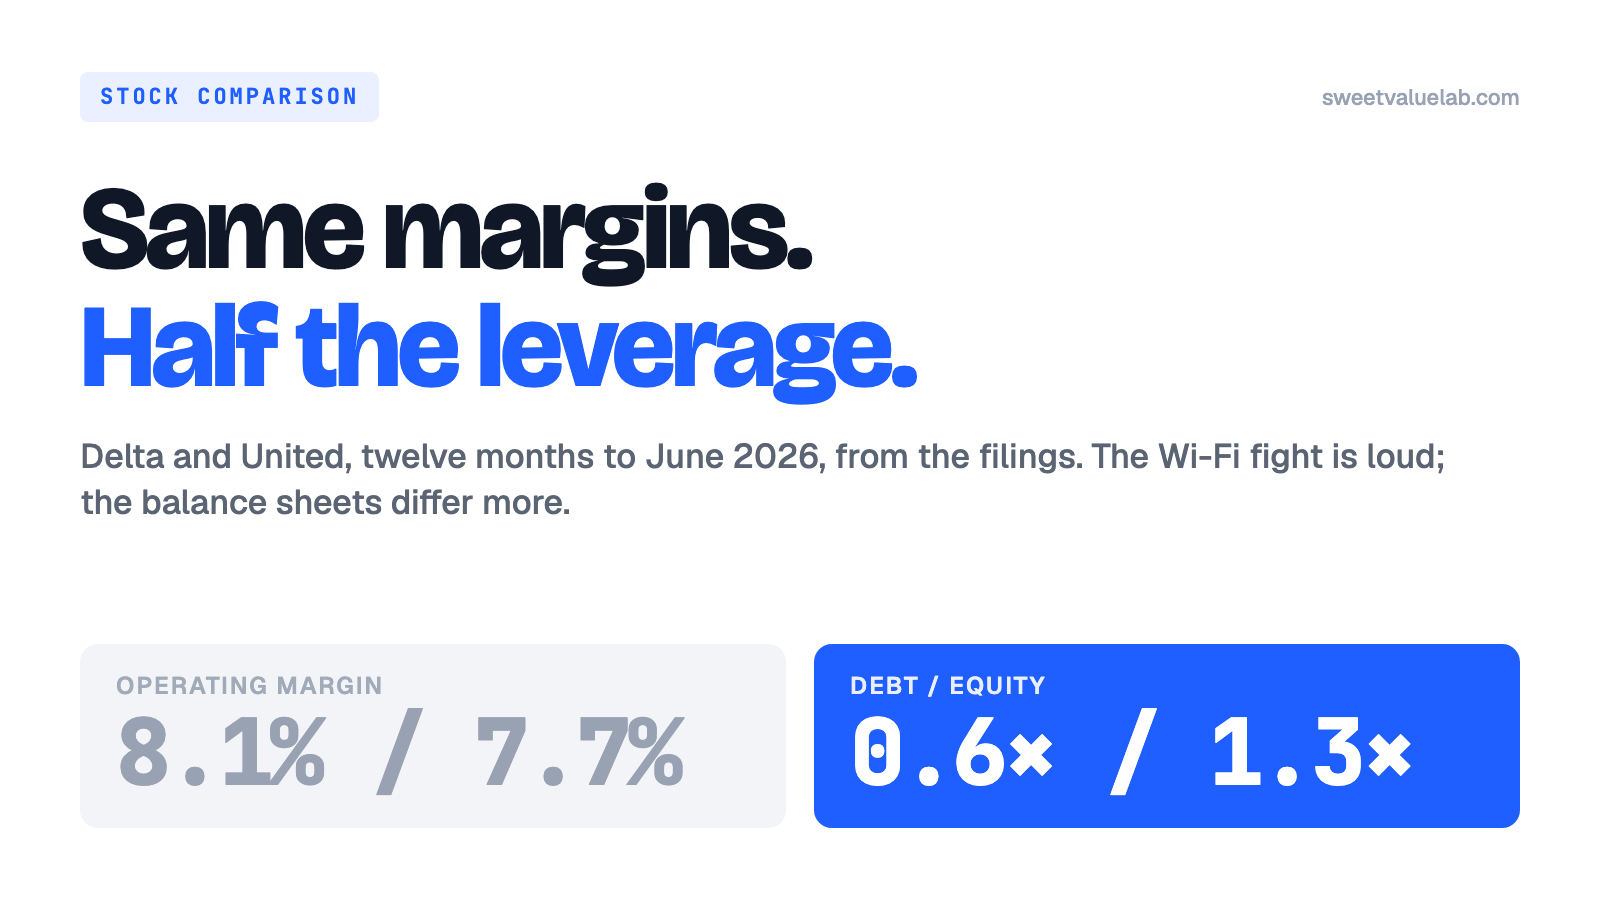
Delta and United earn almost the same margin on a dollar of revenue. The market prices them apart, and United carries twice the leverage, from the 2026 filings.
Read →Allen Yan · · 8 min read
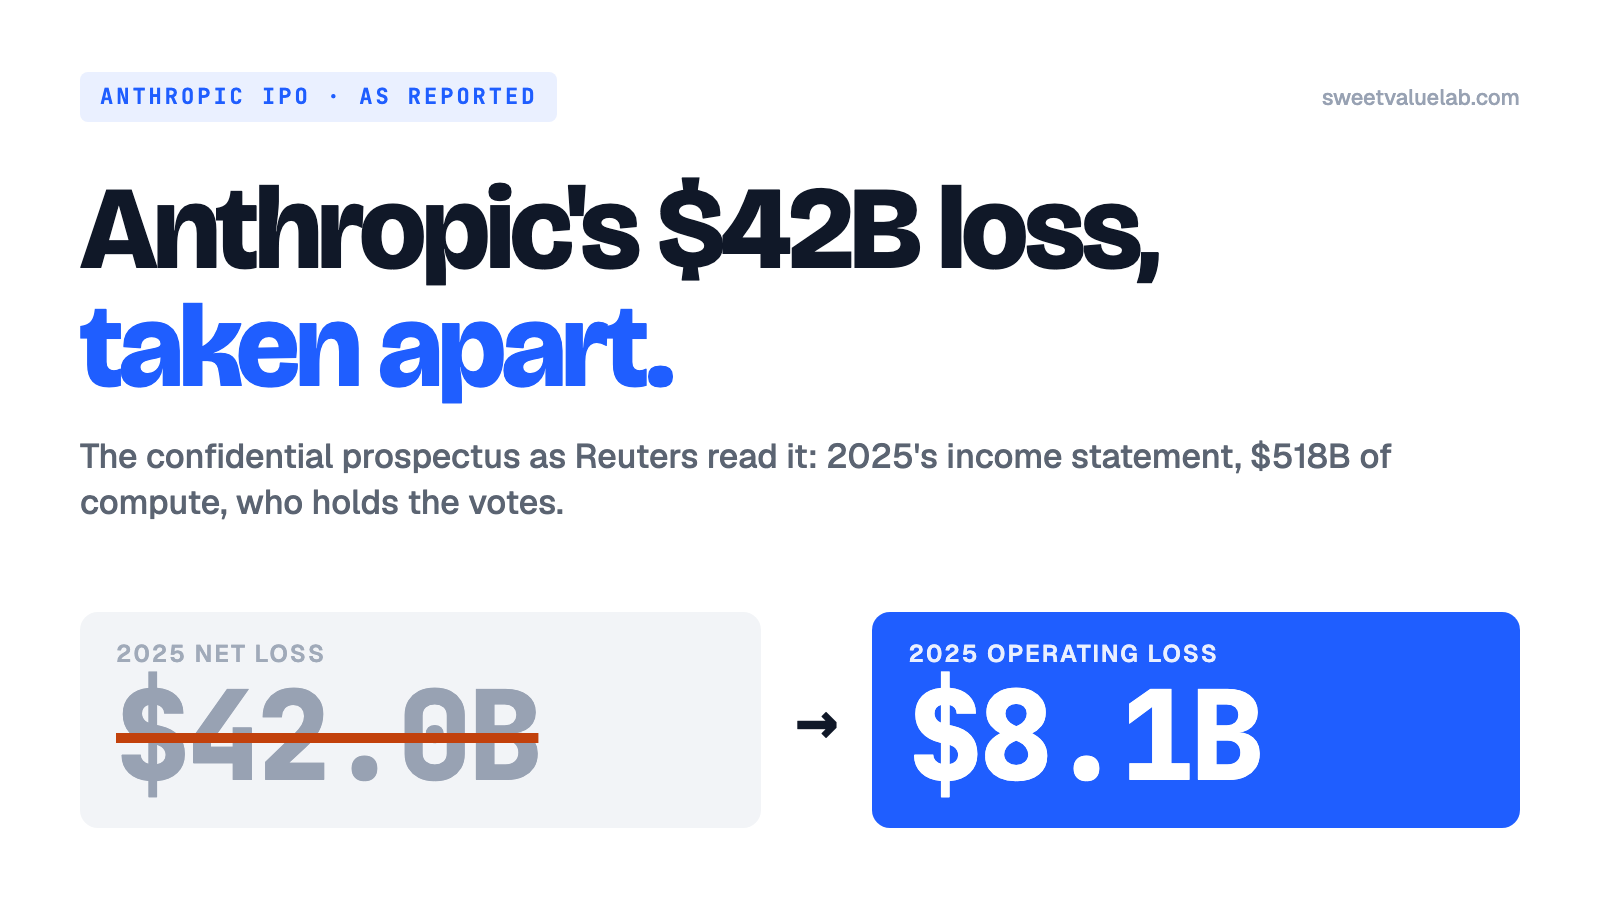
Anthropic's confidential S-1 as Reuters reported it on Sep 28-29, 2026: the income statement, $518B of compute commitments by partner, and the Founder LLC vote.
Read →Allen Yan · · 9 min read
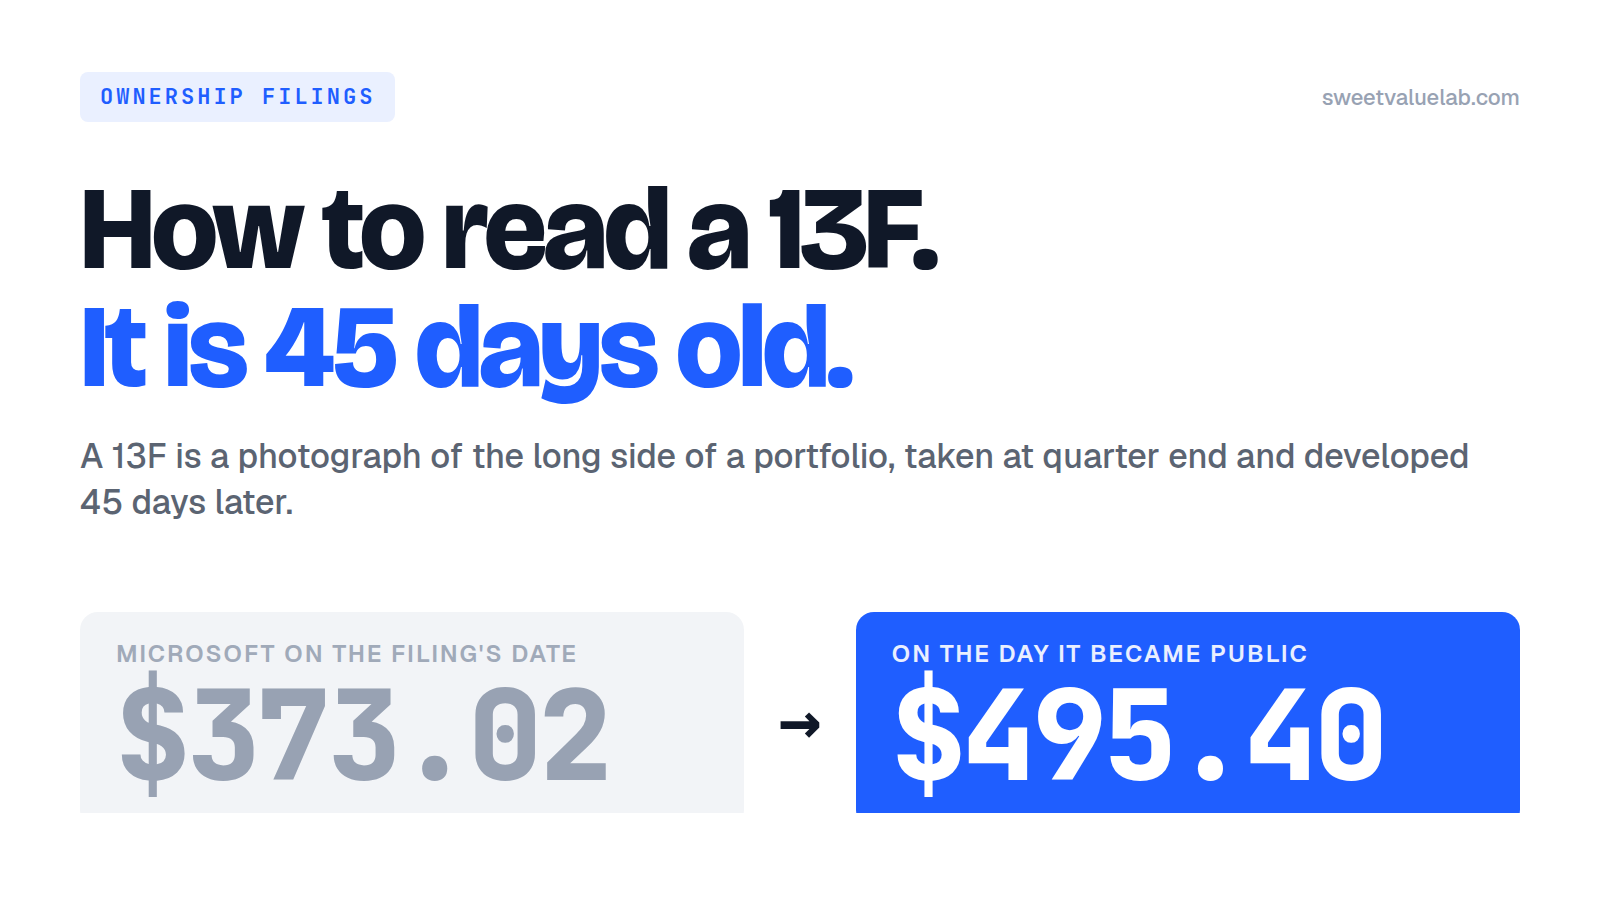
A 13F is a photograph of a portfolio taken on the last day of a quarter and published six weeks later. What it shows, what it never mentions, how to read one.
Read →Allen Yan · · 8 min read
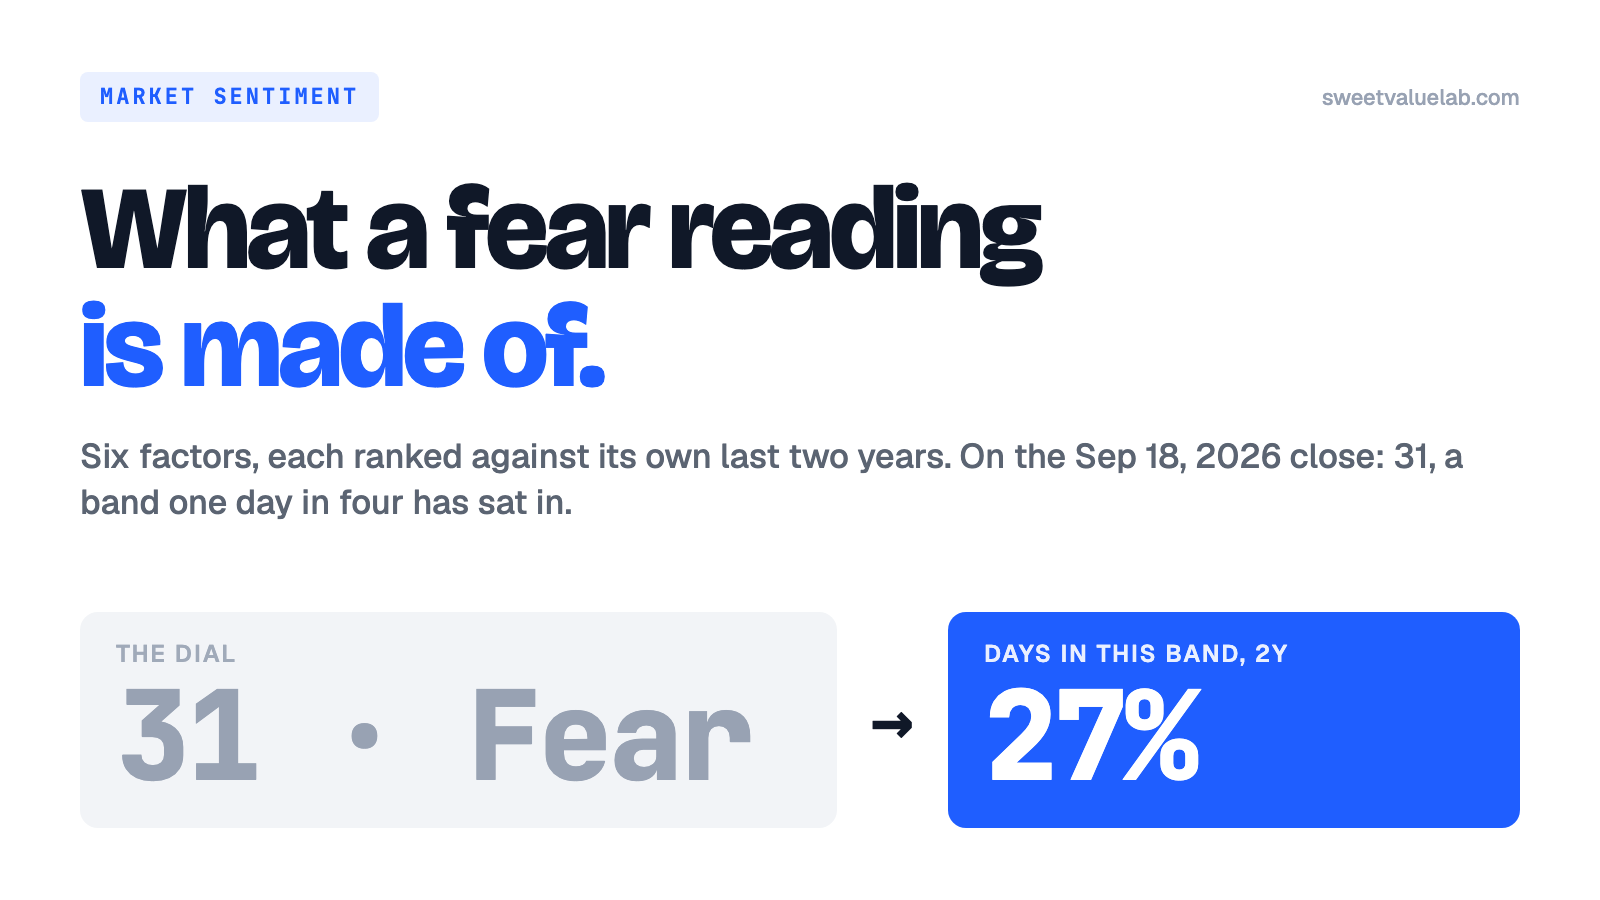
The six factors behind the daily 0–100 score, why each is a two-year percentile, what the S&P 500 did after each band, and how it differs from CNN's index.
Read →Allen Yan · · 5 min read
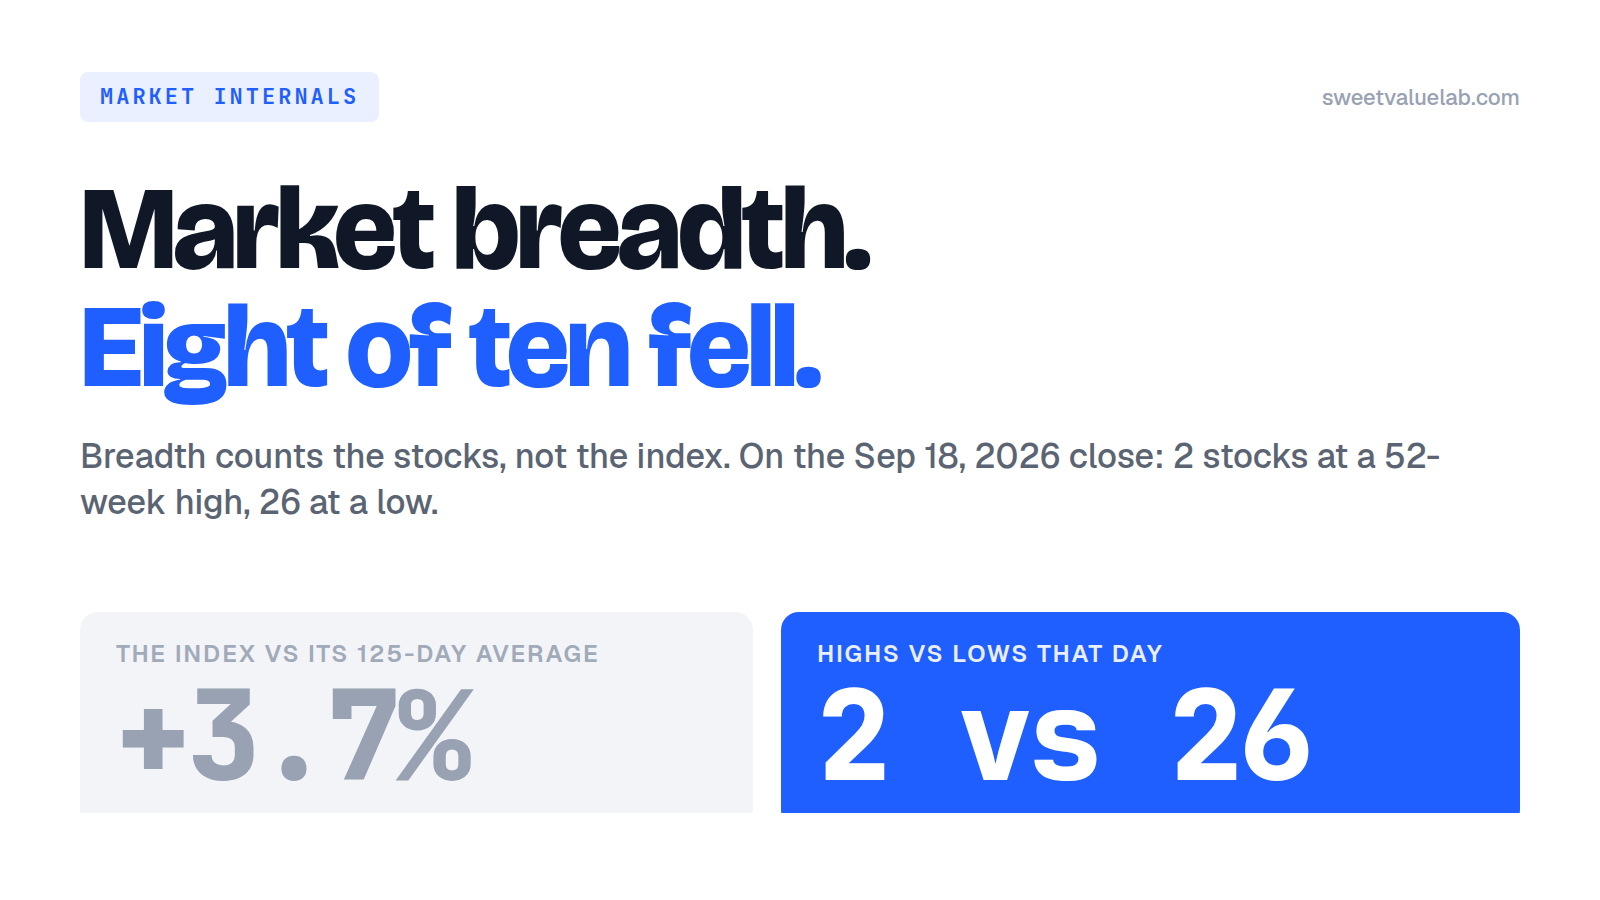
What breadth counts, the arithmetic that lets it disagree with the index, how net new highs and the McClellan summation are built, and where to read both here.
Read →Allen Yan · · 9 min read
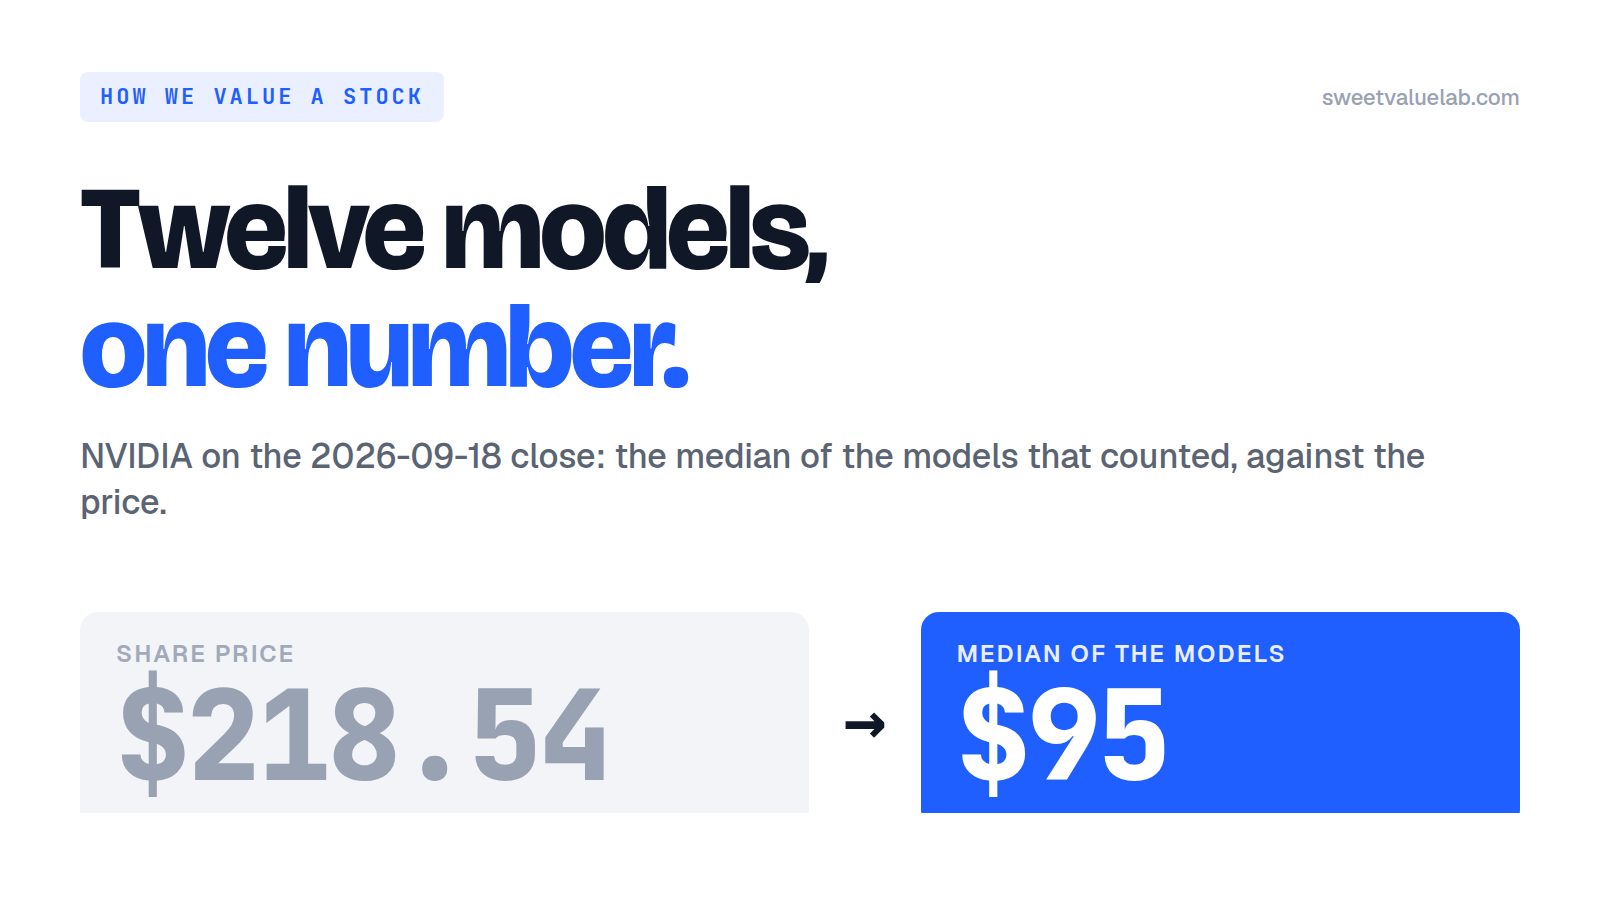
The headline on a valuation page here is the median of twelve models. Which twelve, which of them count for a company, and where the rate comes from.
Read →Allen Yan · · 5 min read
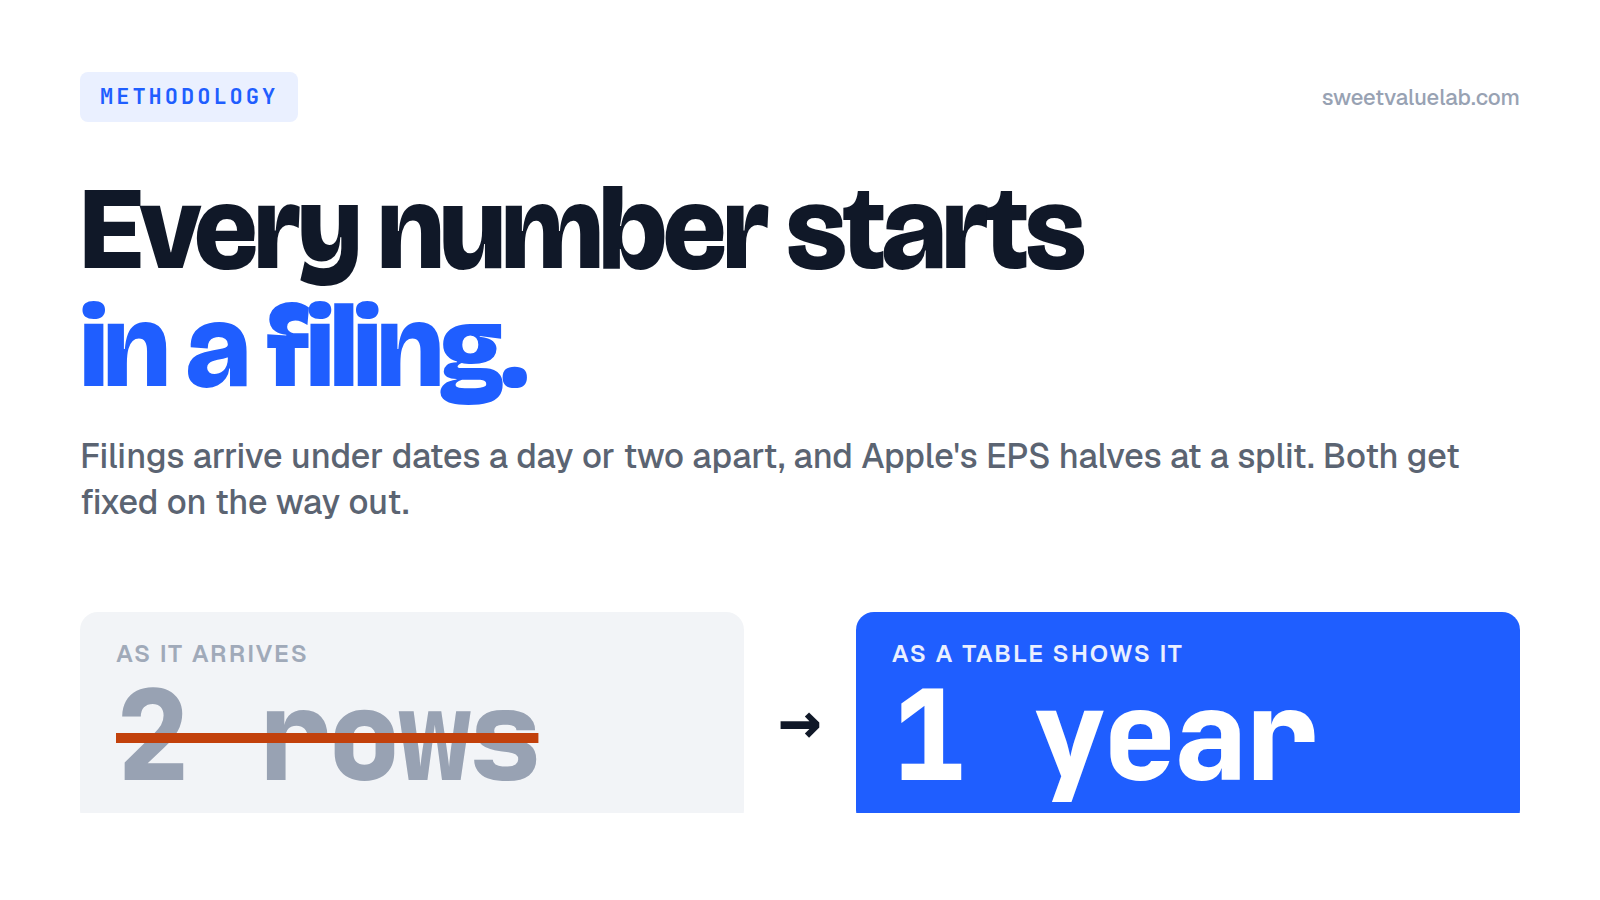
Every figure here starts in a filing. What EDGAR gives, what the fallback fills in, why each row stores when it became public, and what breaks a table.
Read →Allen Yan · · 13 min read
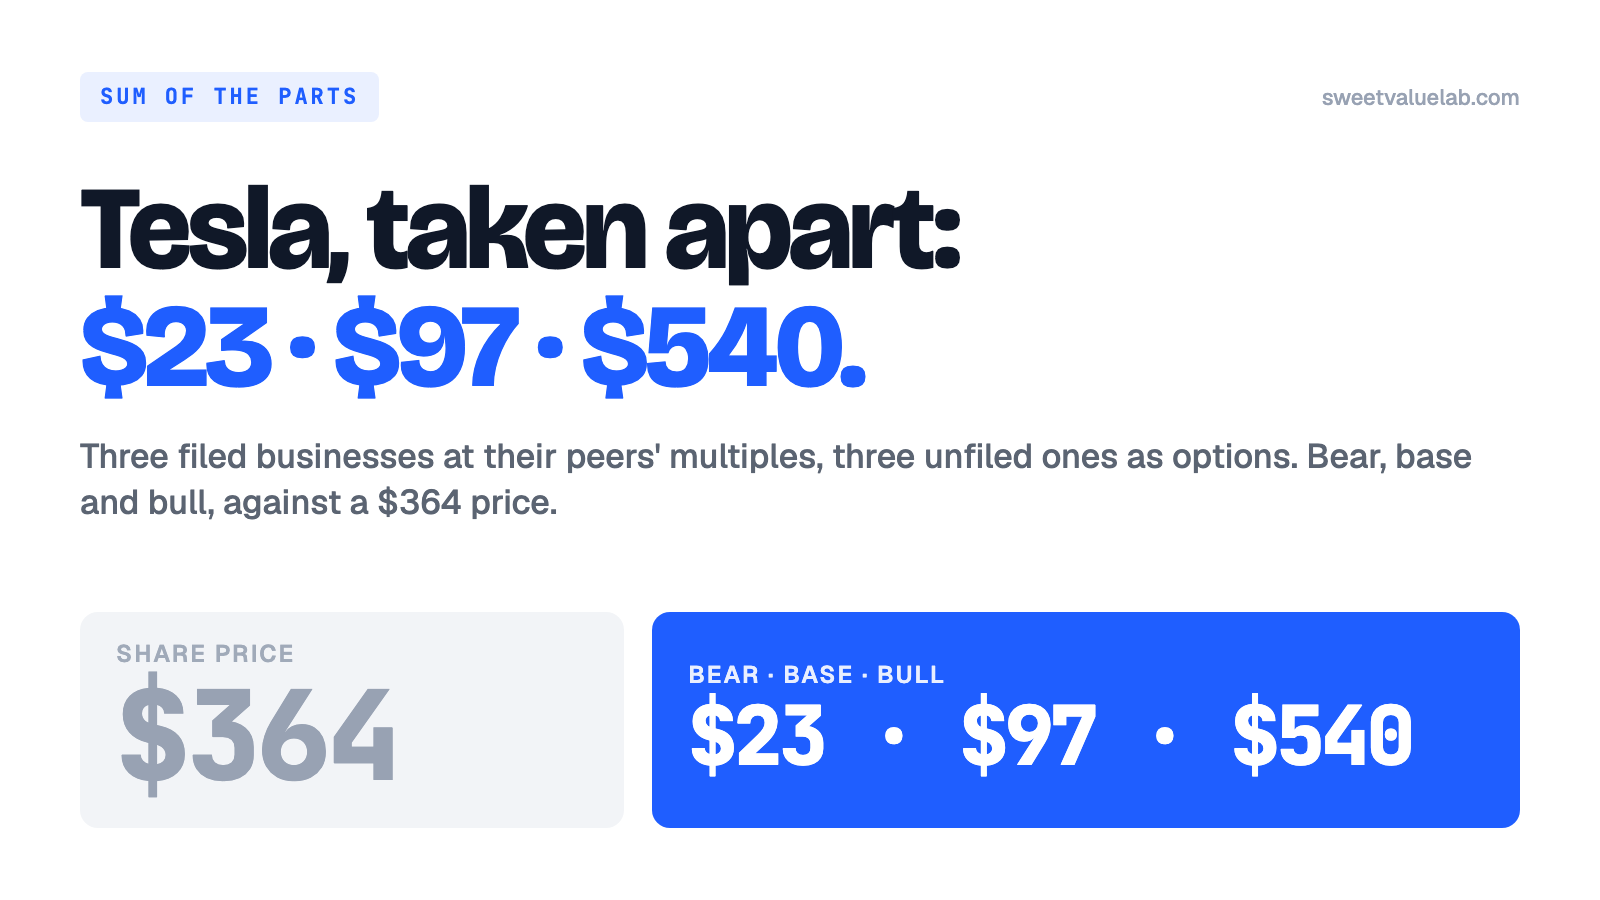
Tesla's three filed businesses at their peers' multiples, three unfiled ones as options. Bear $23, base $97, bull $540 a share, against a $364 price.
Read →Allen Yan · · 12 min read
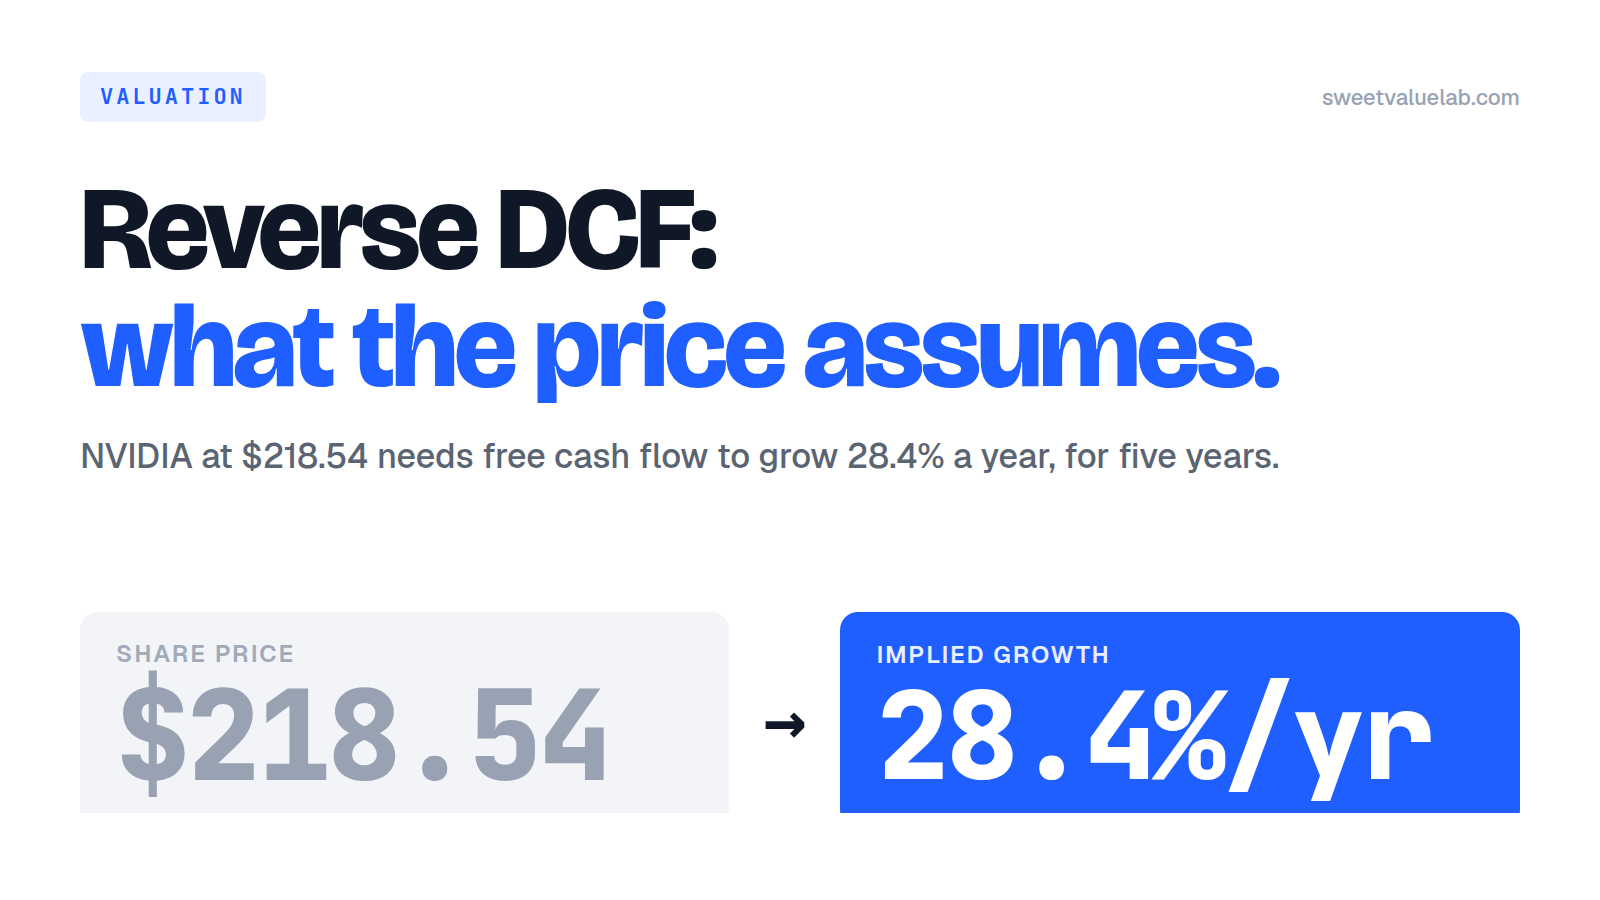
A step-by-step walk from a stock price to the one number it hides: how fast free cash flow has to grow to justify it, worked through on NVIDIA.
Read →Allen Yan · · 11 min read
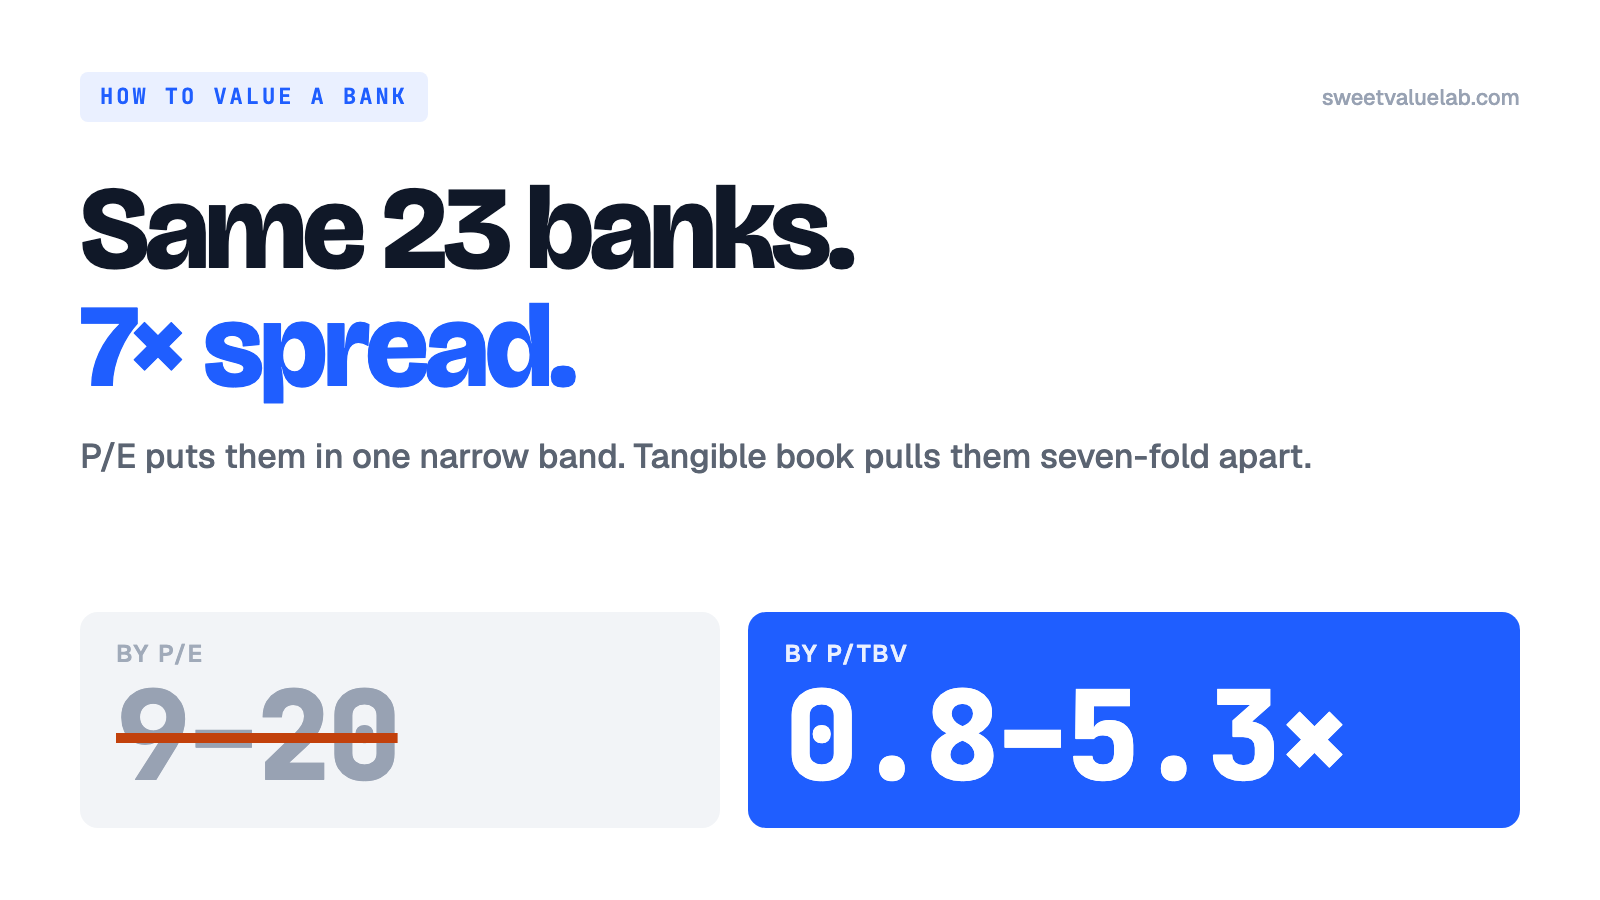
A step-by-step walk from a bank's balance sheet to the three questions that price it: tangible book, the return on it, whether the equity is real, on JPMorgan.
Read →Allen Yan · · 11 min read
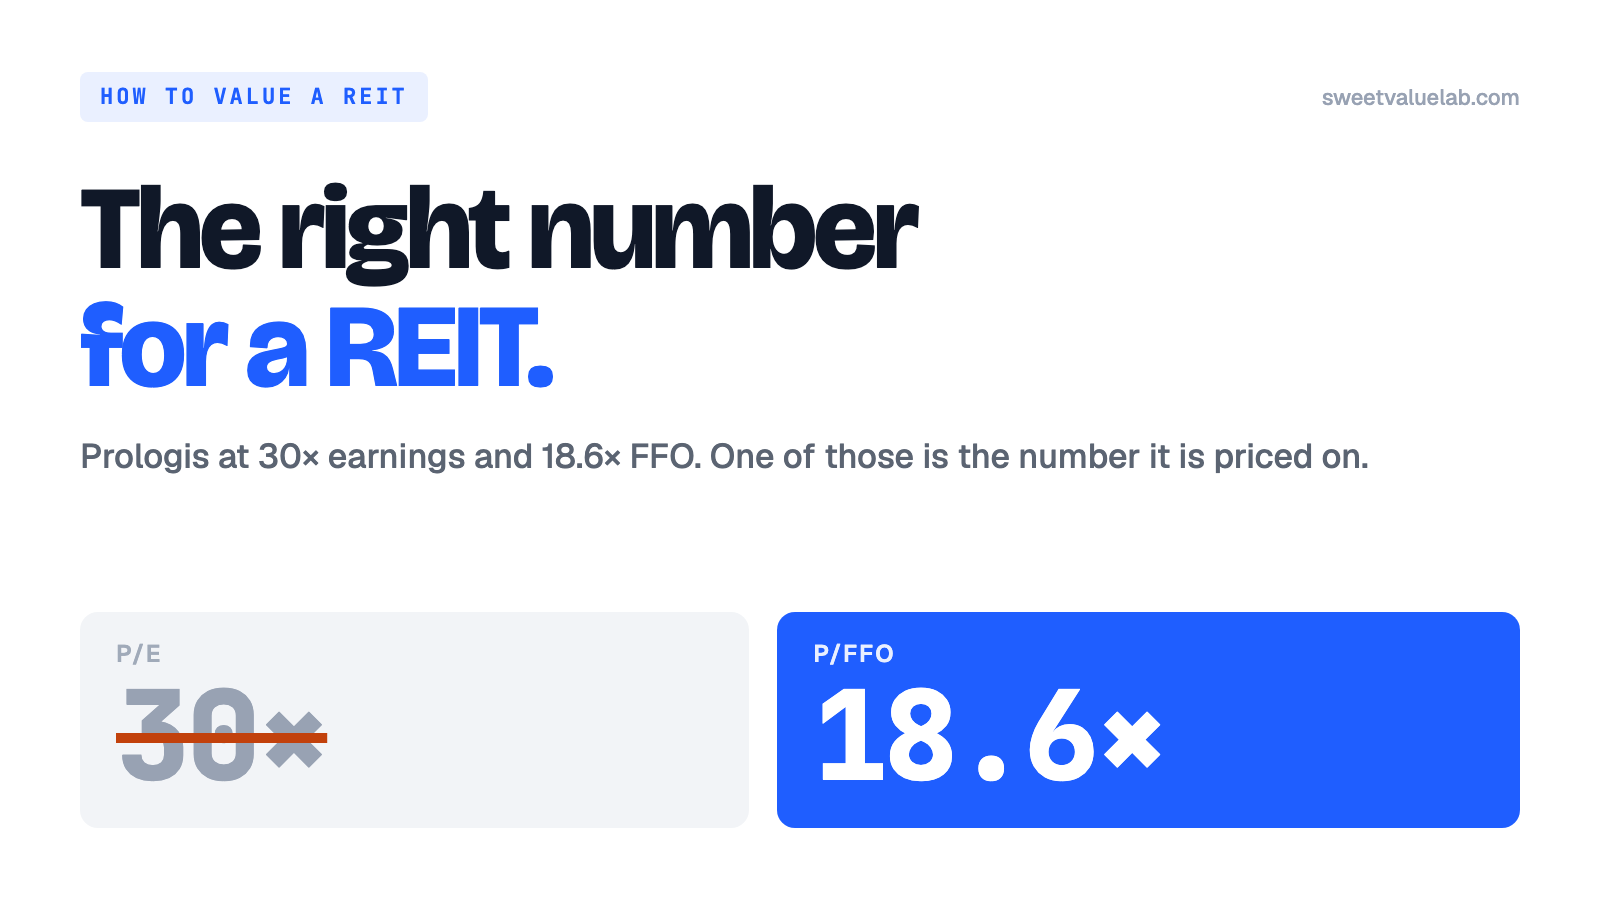
A step-by-step walk from a REIT's income statement to the three questions that price it: FFO and P/FFO, yield against the 10-year, the balance sheet.
Read →Allen Yan · · 10 min read
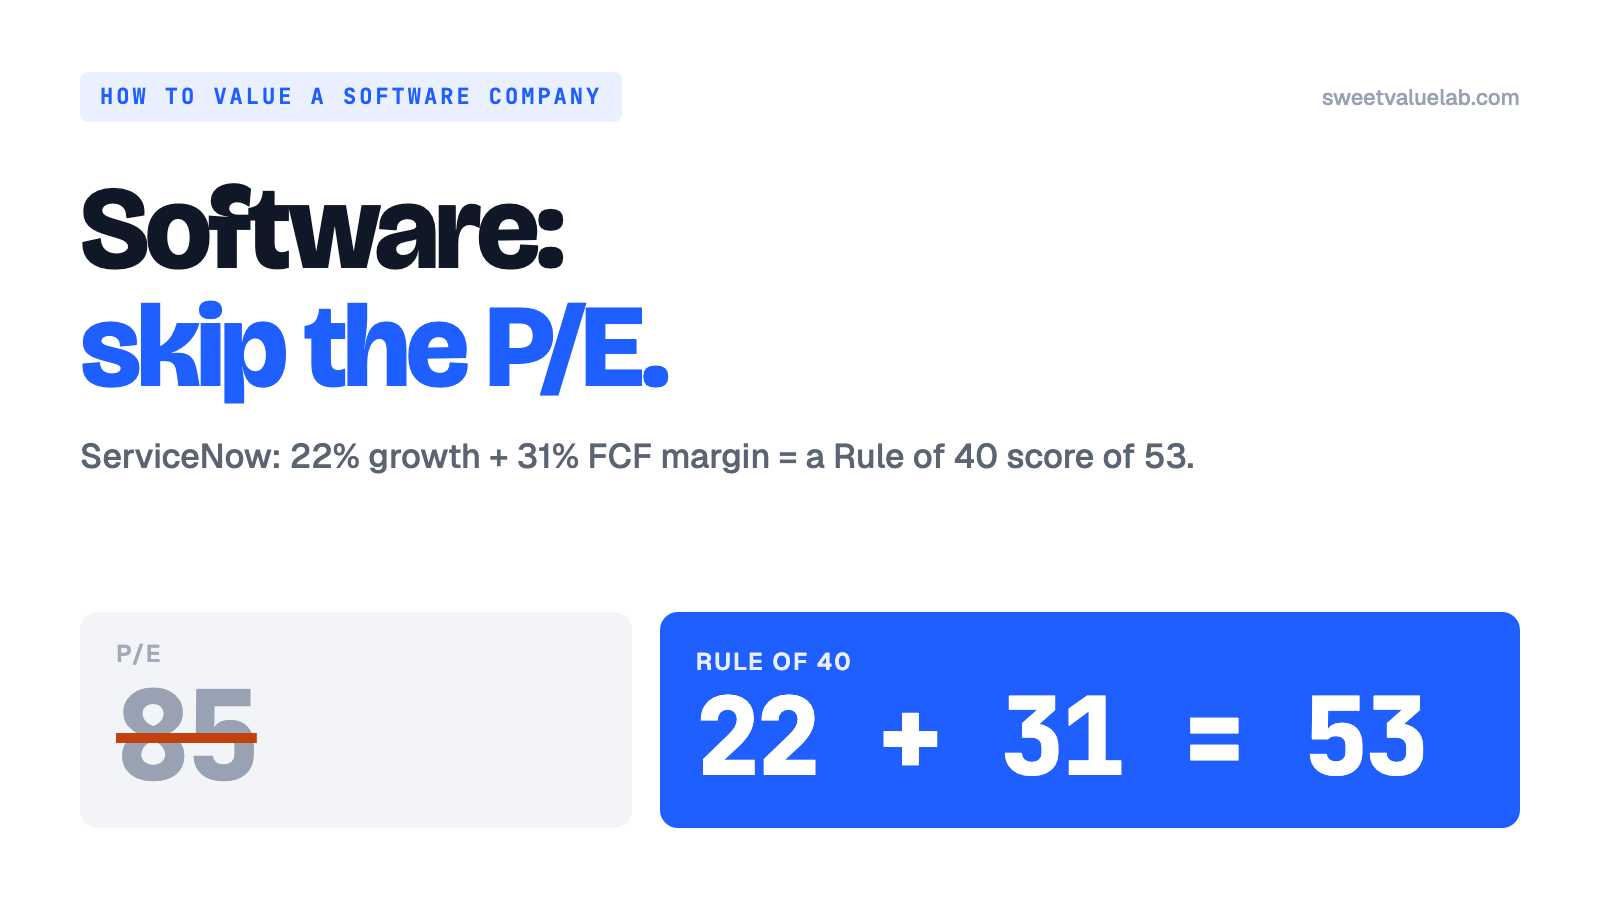
A step-by-step walk from a software income statement to the three questions that price it: growth plus cash, EV per dollar of revenue, the cost of stock.
Read →Allen Yan · · 3 min read
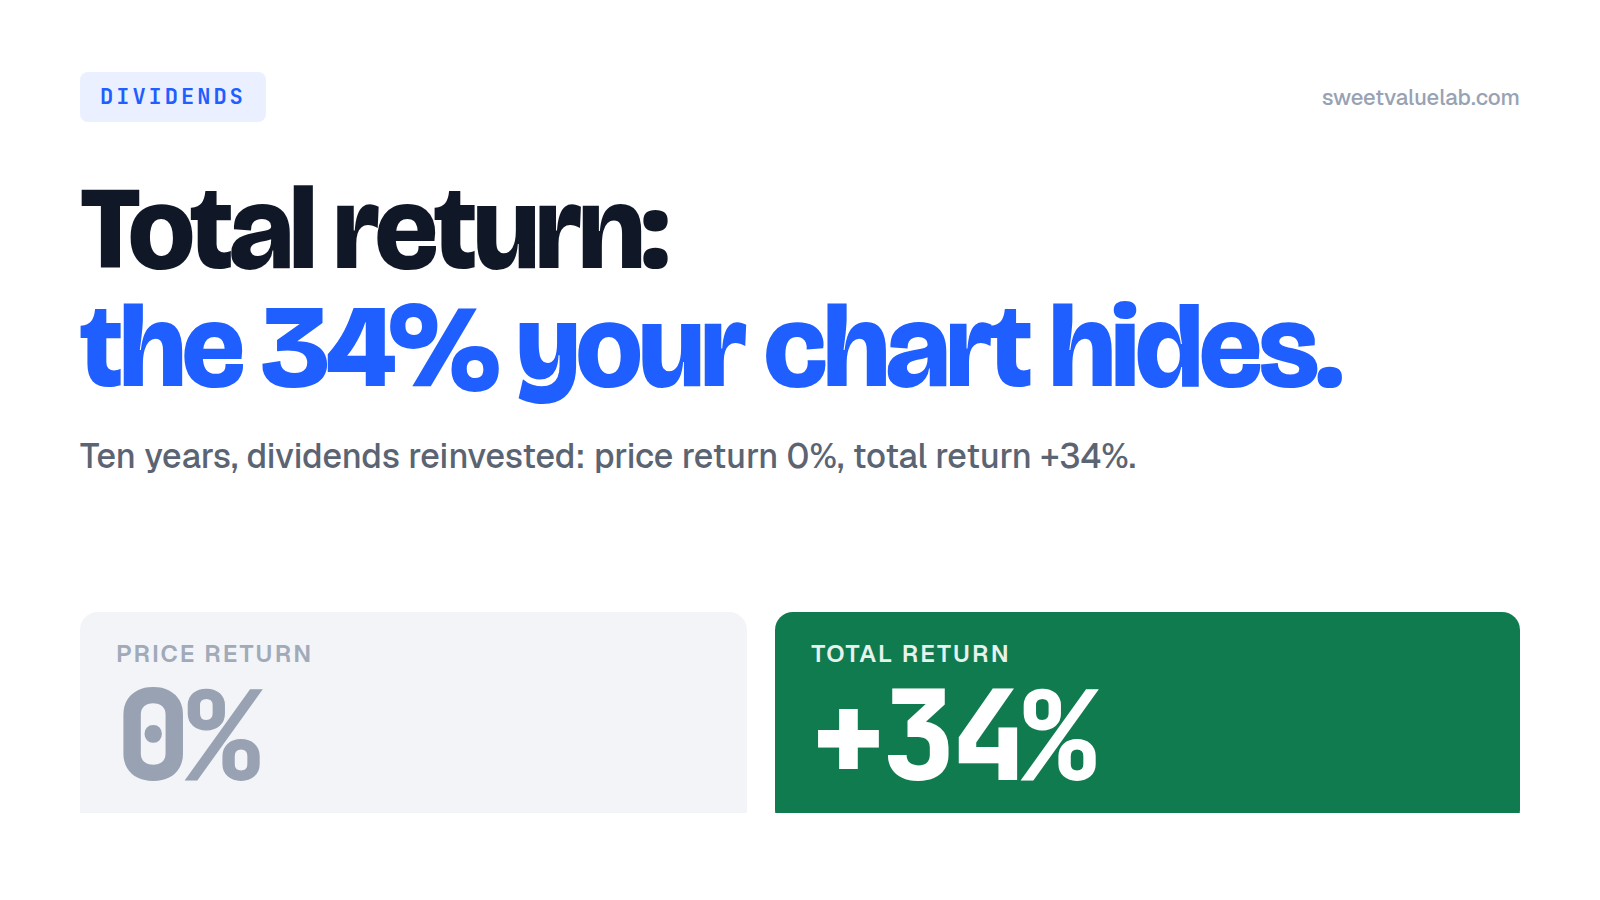
A price chart ignores dividends, so an income fund can look like it went nowhere for a decade. What total return counts instead, and when the gap matters.
Read →Allen Yan · · 4 min read
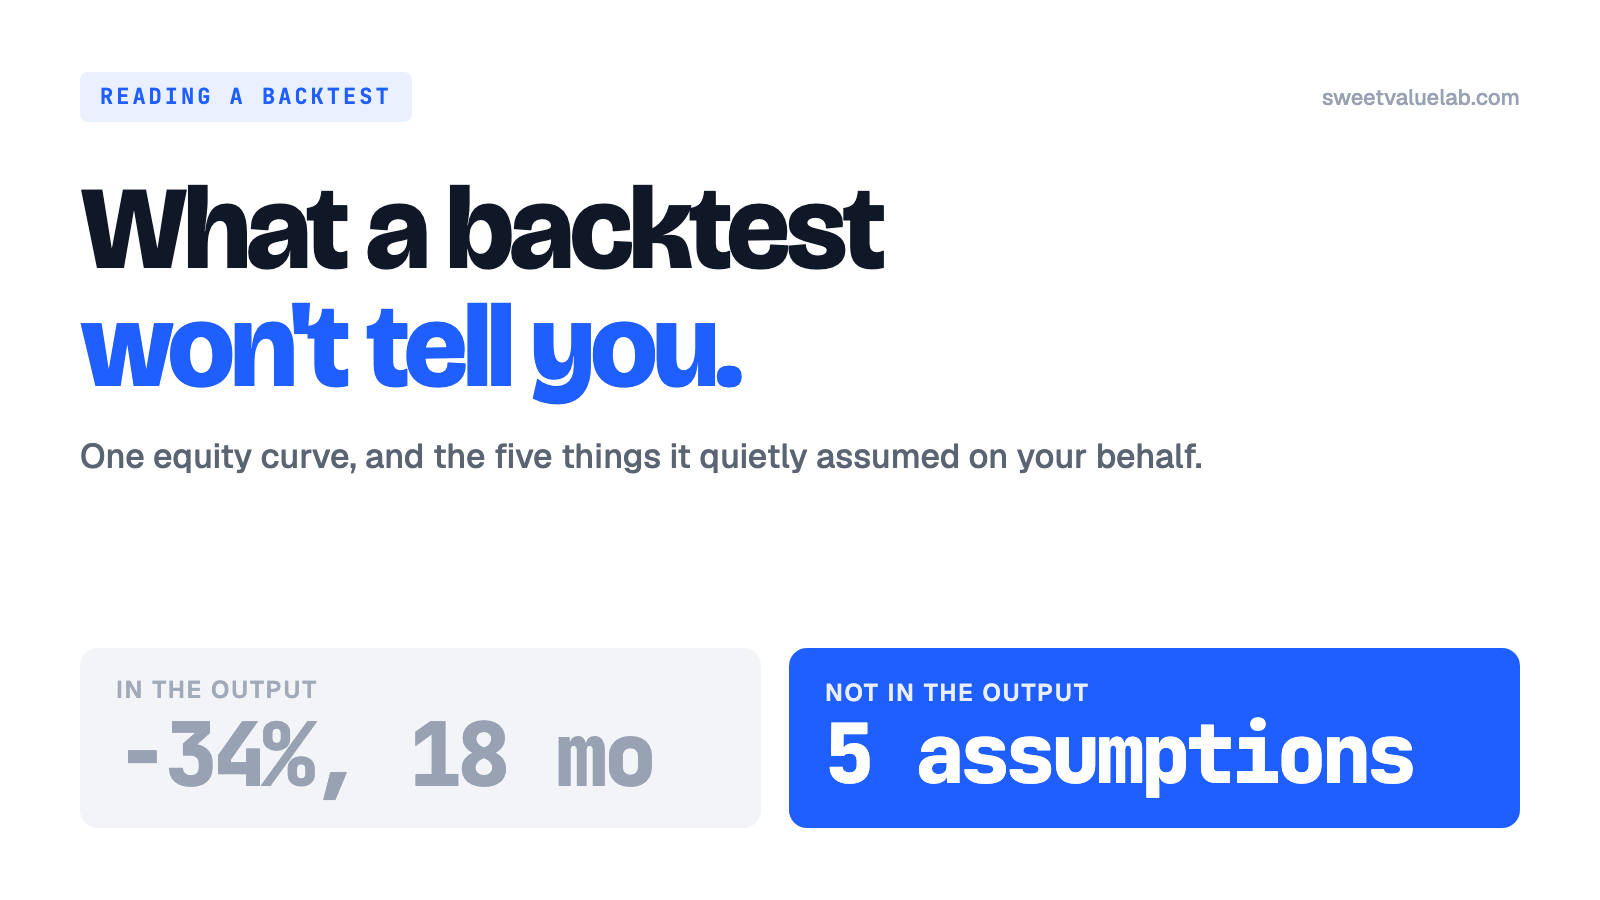
An equity curve answers one question accurately. Here are the five things it quietly assumed on your behalf, and how to read the number it prints.
Read →