Delta vs United by the numbers
 Allen Yan · · 4 min read
Contents
The loudest thing about Delta this week is its Wi-Fi. On March 31, 2026 the airline signed with Amazon Leo, the satellite network Amazon used to call Project Kuiper, for 500 aircraft starting in 2028. United is fitting Starlink across its fleet now. In late September a report that Ed Bastian had told staff Delta did not want to work with Elon Musk went around X, Musk replied that Bastian would lose his job, and a lot of people picked a side.
This post puts the two airlines' filings next to each other instead. Every number below is on the Delta vs United comparison sheet: prices at the September 30, 2026 close, income over the twelve months to June 30, 2026, cash flow for fiscal 2025.
The part of the Wi-Fi story that is confirmed
The deal is confirmed: 500 Delta aircraft get Amazon Leo terminals from 2028, and Wi-Fi stays free for SkyMiles members. In a Bloomberg interview on May 18, Bastian gave price and bandwidth as the reasons, and pointed to Amazon's streaming and gaming as extras.
The internal remark is not confirmed. It reached the public through a tipster who could not verify the quotes, and Delta declined to comment. A widely shared post went further and said Delta wanted to track passengers and sell their data. Nothing Delta, Amazon or SpaceX has published supports that part.
They earn almost the same
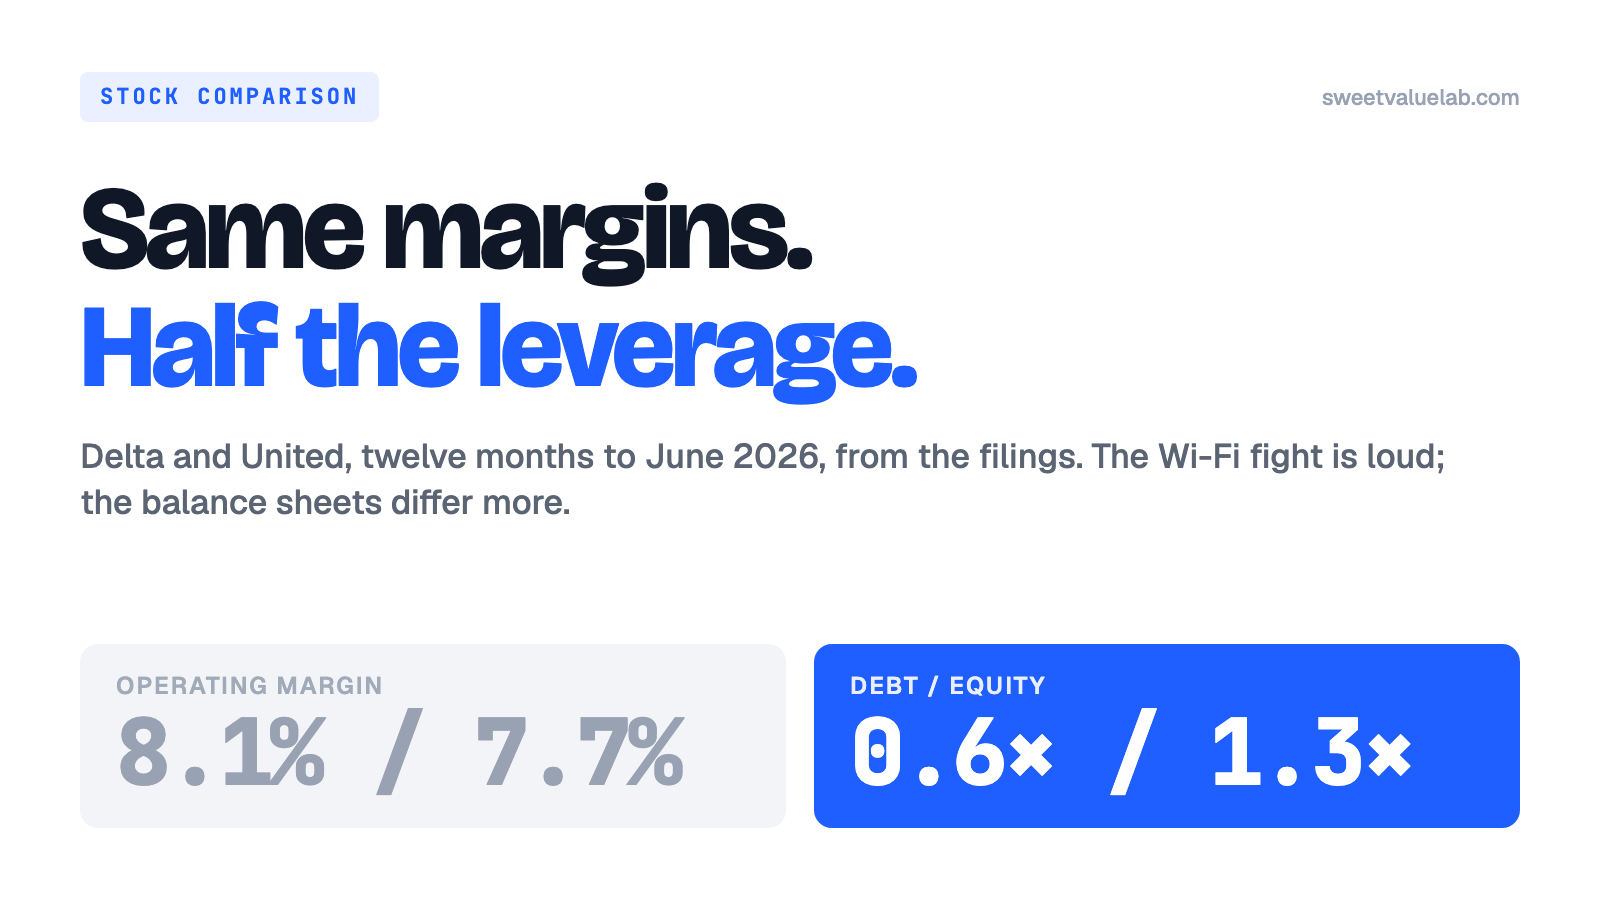
Over the twelve months to June 2026, Delta took in $68.3 billion of revenue and United $62.9 billion. Delta kept 8.1% of it as operating income and United 7.7%. Net margin was 5.8% against 5.6%.
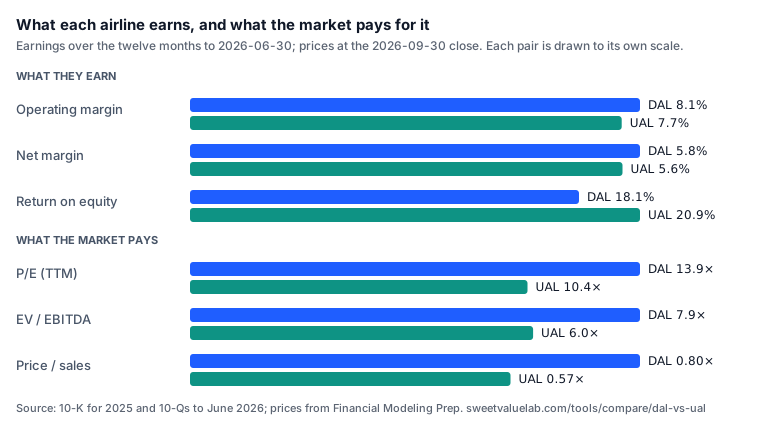
Return on equity tips the other way, 20.9% at United against 18.1% at Delta. United earns that on a thinner layer of equity, which is the subject of the section after next.
One row on the sheet should be skipped. Gross margin reads 22.8% for Delta and 64.1% for United, which would mean two airlines selling the same seat at wildly different costs. They are not. The two companies put fuel, wages and landing fees on different sides of the gross-profit line in what they file, and the gap is an accounting choice. Operating margin does not depend on where that line is drawn.
Delta's trailing earnings also carry a bad quarter. It lost $289 million in the first three months of 2026, which is why its trailing EPS of $6.02 sits below the $7.66 it reported for fiscal 2025.
The market pays more for Delta's dollar
At the September 30 close Delta traded at 13.9 times trailing earnings and United at 10.4. On enterprise value to EBITDA, which counts debt as part of the price, it was 7.9× against 6.0×. A dollar of Delta's sales is priced at 80 cents and a dollar of United's at 57.
Free cash flow tells a different story. Delta produced $3.8 billion in fiscal 2025 and United $2.6 billion, a 7.0% and 7.1% yield on their market values. United spent $5.9 billion on aircraft and other capital items that year against Delta's $4.5 billion, and that spending is the gap between similar earnings and smaller free cash flow.
The reverse DCF runs the same question backwards. At a 10% required return, Delta's price implies free cash flow growing about 6% a year for five years; United's implies about 9.5%. Analysts expect United's revenue to grow 15.2% next year and Delta's 4.8%, so the higher bar sits on the company the forecasts are more generous to.
Where they really differ: the balance sheet
United carries more debt and more cash. At June 30, 2026, Delta's debt net of cash was $8.2 billion and United's $11.1 billion. Debt is 0.6 times Delta's equity and 1.3 times United's. Measured against a year of EBITDA, net debt is 1.0× at Delta and 1.4× at United.
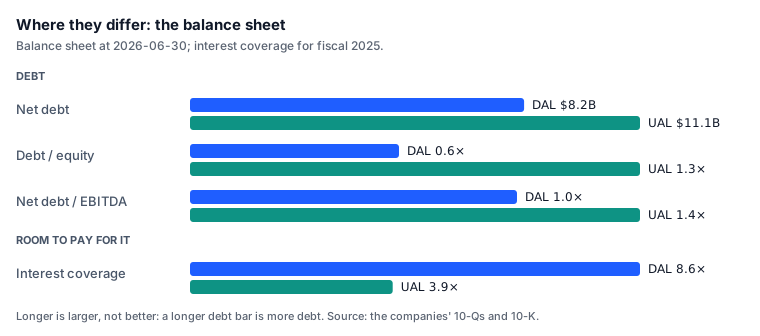
Interest coverage shows what that costs. In fiscal 2025 Delta's operating income covered its interest bill 8.6 times and United's 3.9 times. A rough year for airlines, the kind 2020 was, hits the second number much harder.
United's quarterly filings in our data have no total-debt line, so its debt figure is the December 2025 one while its equity is June 2026. The ratio moves a little with that, but the gap between the two airlines is far wider than the mismatch.
The dividend follows from the same difference. Delta paid $0.78 a share over the past twelve months, a 0.9% yield and 13% of earnings. United paid nothing.
Two different years for the shares
Over one year Delta's shares rose 47.1% and United's 15.0%. Over two years the order flips: United is up 94% and Delta 64%. Since January Delta is up 20.3% and United is down 0.8%.
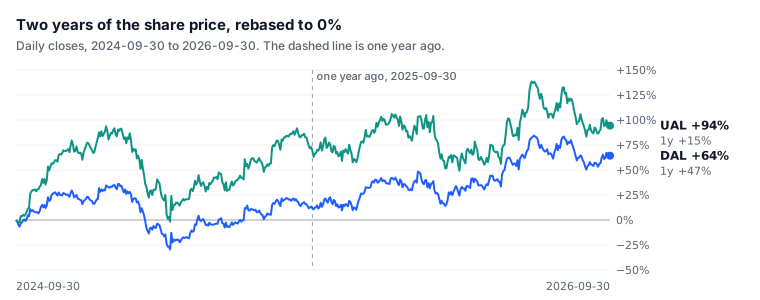
Most of United's lead was built in the first year of the chart. Delta has narrowed it since September 2025 without closing it.
What the valuation models say
Too spread out to give one number for either: $83 to $290 a share for Delta, $167 to $470 for United. The sheet says "models disagree" for Delta and withholds the median for United.
Where the Wi-Fi fits
Neither airline reports what in-flight connectivity costs, so its effect on these numbers cannot be read from the filings. Delta's Leo installs begin in 2028, two annual reports from now, and both companies spend $4.5 to $5.9 billion a year on capital items.
The full sheet, with seventy rows and the period each one covers, is at Delta vs United. Each airline's own page has its models laid out: Delta, United. Other matchups are on the compare tool.
The weekly
The week's 13F filings, insider trades and earnings, plus new research on the site. One email a week, no account.
More posts
- Anthropic's $16.8B quarter: the investor day numbers
- What is a DCF? What a corner shop is worth
- How the 10-year Treasury moves every valuation on this site
- Anthropic's IPO prospectus: the numbers behind the $42B loss
- Who actually owns this stock: how to read a 13F
- How to read a market sentiment gauge
- Market breadth: the index can rise while most stocks fall
- How we value a stock: twelve models, one number
- Where the numbers come from: filings, point in time
- Tesla, taken apart: a sum of the parts in three scenarios
- How to read a reverse DCF: the growth a stock price implies
- How to value a bank: P/TBV, ROTCE and the line
- How to value a REIT: FFO, P/FFO and the yield spread
- How to value a software company: Rule of 40 and SBC
- Total return vs price return: what a stock chart leaves out
- What a backtest cannot tell you