Tesla, taken apart: a sum of the parts in three scenarios
 Allen Yan · · 13 min read
Contents
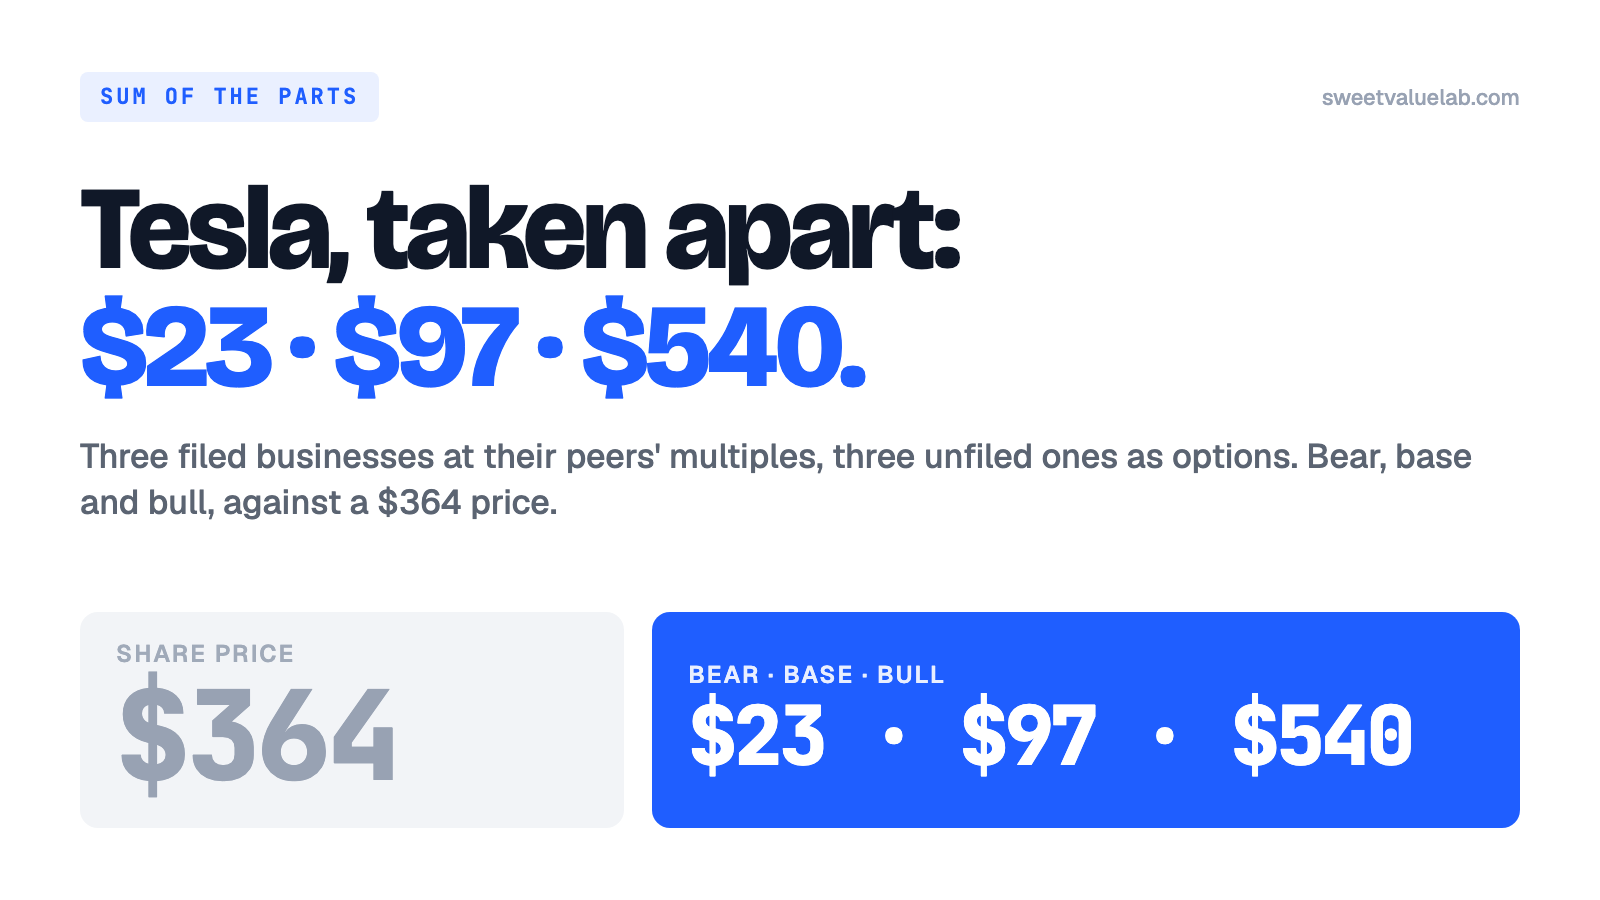
Tesla closed at $364.27 on 2026-09-18, which makes the shares worth $1.44 trillion. The question this post answers is one you can act on either way: if you pay $364, which assumptions are you paying for? A believer and a sceptic will read the answer differently. Both should know what it is.
The tool is a sum of the parts, SOTP for short. Split the company into its separate businesses, value each on the multiples its own industry trades at, add the pieces up, add net cash. It suits a company whose businesses are too different for one multiple, and Tesla's are: a carmaker, a battery-storage maker, a service network, a software subscription, a taxi fleet that exists in seven cities, and a robot that does not yet exist as a product. Three of those have revenue lines in the 10-Q. Three do not. The three without get valued as options, in three tiers of faith, from a build-up whose every input is on this page, and each option pays for what it has to build.
The numbers come from the 10-Q for the quarter ended 2026-06-30, the FY2025 10-K, and the TSLA page here. Twelve months to June 2026 throughout, 3,949.5 million shares on the cover of the 10-Q, of which 423.7 million are the CEO award's restricted shares that exist only if its milestones are met (more on that below), no forecast until the options section, and there the forecast is spelled out.
The businesses: six names, three revenue lines
Tesla reports two segments, automotive and energy, and inside automotive it separates the cars from services. Everything else the company talks about lives inside those lines or in no line at all.
| Business | Where it is in the filings | Twelve months to June 2026 |
|---|---|---|
| Cars, leasing, regulatory credits | Automotive revenues | $75.6B revenue, $14.1B gross profit |
| Megapack, Powerwall, solar | Energy generation and storage | $12.8B, $3.8B gross profit |
| Repairs, used cars, insurance, merchandise | Services and other | $15.2B, $1.7B gross profit |
| FSD software | Inside automotive; not broken out | no line |
| Robotaxi | No line; a few hundred cars in seven cities | no line |
| Optimus | No line; no product | no line |
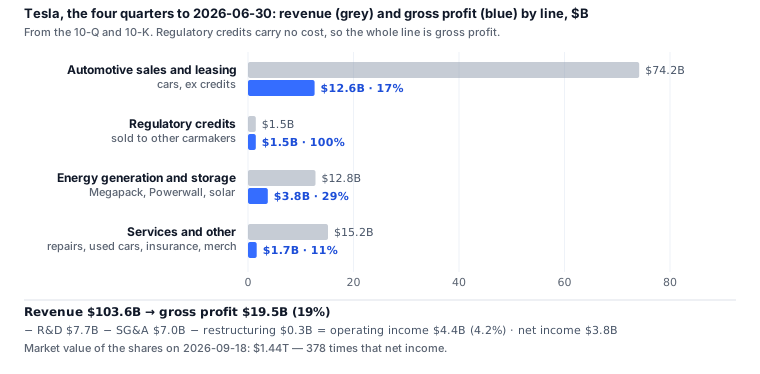
Two things in the figure matter for what follows. The car business earns a 17% gross margin before credits, which is Toyota's margin in its year to March 2026. And the credits line, sold to other carmakers that need it for emissions rules, was $1.0 billion in the first half of 2025 and $0.5 billion in the first half of 2026. It carries no cost, so every dollar lost there comes straight out of gross profit.
The last two quarters
Before valuing anything, the direction. Second quarter against second quarter. The first half for capital spending.
| $M | Q2 2025 | Q2 2026 | Change |
|---|---|---|---|
| Revenue | 22,496 | 28,236 | +26% |
| Automotive revenues | 16,661 | 20,516 | +23% |
| Energy | 2,789 | 3,139 | +13% |
| Services and other | 3,046 | 4,581 | +50% |
| Gross profit | 3,878 | 4,751 | +23% |
| R&D | 1,589 | 2,371 | +49% |
| SG&A | 1,366 | 1,982 | +45% |
| Operating income | 923 | 398 | −57% |
| Net income | 1,172 | 1,114 | −5% |
| Capex, first half | 3,886 | 8,282 | +113% |
Revenue grew a quarter. Gross profit grew a quarter. Operating income fell by more than half, because R&D and administrative cost grew by half. Capital spending doubled. Whatever the car business improves is being spent, now, on the three businesses with no revenue line. That is the filed fact the rest of the post is built on.
Segment one: automotive
$75.6 billion of revenue with credits and leasing included. The comparables are carmakers, on price to sales rather than enterprise value to sales, because Toyota's and GM's enterprise values carry the debt of their finance arms and would flatter the multiple.
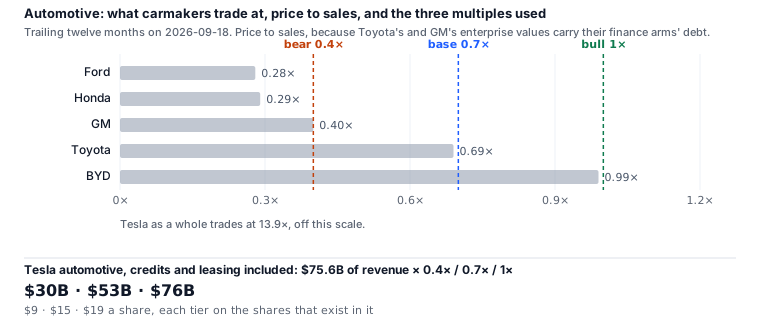
The bear multiple is GM's. Tesla has GM's operating margin, 4%, and a shrinking credits line. The base is Toyota's: the same gross margin on a far larger and steadier business. The bull is BYD's, the one carmaker growing faster than Tesla. $30 billion, $53 billion, $76 billion. Under $20 a share in every tier.
Segment two: energy
$12.8 billion of revenue at a 29% gross margin, growing 13% in the second quarter after growing far faster in 2025. There is no clean comparable. Fluence sells grid batteries and trades at half its revenue; Enphase and SolarEdge sell solar electronics; GE Vernova and Vertiv sell power equipment into data centres and trade at six to eight times revenue.
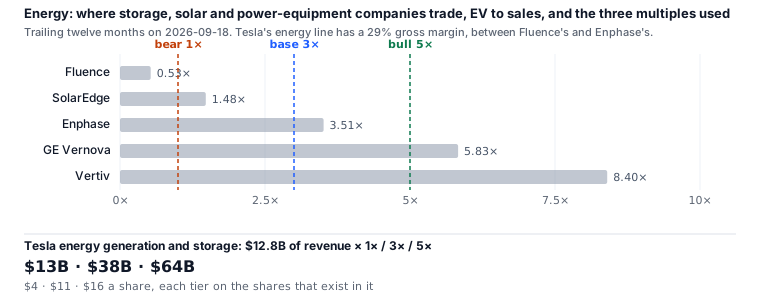
The base multiple of 3× sits between the solar-electronics names and the power-equipment names, which is roughly where a 29%-margin battery business belongs. $13 billion, $38 billion, $64 billion. In the bull tier the energy business is worth almost as much as the car business, which says more about carmaker multiples than about Megapacks.
Segment three: services
$15.2 billion of revenue at an 11% gross margin, growing 50% in the second quarter. Dealers and used-car retailers are the comparables: AutoNation at 0.6× revenue, CarMax at 1.0×, Carvana at 3.0×. The tiers are 0.3×, 0.6× and 1.0×: $4.6 billion, $9.1 billion, $15.2 billion. This segment does not decide anything, and there is no figure for it.
The three businesses with no revenue line
This is where the price lives, and where a sum of the parts has to be honest about what it is doing. A business with no revenue cannot be valued on a multiple of revenue. It can be valued as an option: pick a year when it might exist, build what it would earn, apply a multiple, bring the number back to today, and take off what it costs to build. Each input is a judgement. Write them all down. A reader who disagrees with one can change it and see what moves.
Four rules apply to every tier below.
The year is 2030, and 2030 values are brought back to the 2026-09-18 close at 10% a year, a factor of 1.46. Everything is taxed at 20%. An option that owns its units pays for them. A robotaxi fleet is cars the company has to buy, $30,000 each; that capital is spent on the way to 2030, so it is brought back over half the years, a factor of 1.21, and taken off the option's value, which is never allowed below zero, because an option not worth building is not built. Software subscribers and bots that are sold carry no capital of their own. And stated timelines are discounted. Tesla's own record is the reason. The Cybertruck was unveiled in November 2019 for production in late 2021 and delivered its first units in November 2023. The Semi was unveiled in November 2017 for 2019 and delivered in December 2022. In April 2019 the company said a million robotaxis would be on the road by the end of 2020; in September 2026 there are a few hundred, in seven cities. Hardware has arrived about two years late. Autonomy has run five years and counting. So the base tier treats things promised for 2027 as arriving around 2030, half-size. The bull tier takes the company at its word: its timeline, and its own definition of success, the operational milestones of the 2025 CEO award, which the FY2025 10-K lists as 20 million cars delivered, 10 million active FSD subscriptions, 1 million bots delivered, 1 million robotaxis in commercial operation, with adjusted EBITDA milestones from $50 billion to $400 billion and market-capitalisation milestones from $2 trillion to $8.5 trillion.
One more rule for the software line. FSD subscriptions are sold today and sit inside automotive revenue, which has already been valued at a carmaker's multiple. The option counts only what is added on top of that, so its bear tier is zero: the subscribers that exist are in the line, and if unsupervised driving never comes, nothing is added.
| 2030 build | Bear | Base | Bull |
|---|---|---|---|
| FSD software: subscribers added | 0 | 6M | 10M (award milestone) |
| price a year | — | $1,200 | $1,800 |
| margin · multiple | — | 70% · 25× | 70% · 30× |
| 2030 value → today | $0 | $101B → $69B | $302B → $207B |
| Robotaxi: fleet | 0 | 500k | 2.5M (the company's timeline) |
| paid miles a day · fare | — | 100 · $1.50 | 130 · $1.40 |
| 2030 revenue | — | $27.4B | $166B |
| operating margin · multiple | — | 30% · 30× | 45% · 40× |
| cars to buy → today, taken off | — | $15B → −$12B | $75B → −$62B |
| 2030 value → today, net | $0 | $197B → $122B | $2,391B → $1,571B |
| Optimus: bots delivered | 0 | 100k | 1M (award milestone) |
| price · margin · multiple | — | $30k · 25% · 40× | $30k · 25% · 40× |
| 2030 value → today | $0 | $24B → $16B | $240B → $164B |
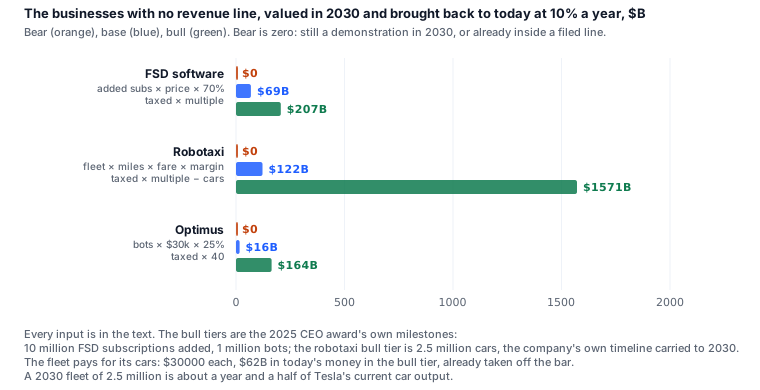
A few of the choices deserve a sentence. The robotaxi bear tier is zero because a business that is still a demonstration in 2030 is an option that expired, and the same for Optimus. The robotaxi base fleet of 500,000 is half the award's milestone, arriving three years after the company's own timeline would put it; at 100 paid miles a day it earns $27 billion a year, and it costs $15 billion of cars. The bull fleet of 2.5 million cars is what the company's own statements imply for 2030, "millions" having been promised for 2026 and 2027; at 130 paid miles a day it earns $166 billion a year at a 45% margin, it costs $75 billion of cars, and 2.5 million cars is about a year and a half of Tesla's entire current output. The multiples, 30× and 40×, are what fast-growing businesses get. None of these is the right number. There is no right number. They are three coherent sets, and the sum below shows what each set is worth.
Sum of the parts
| $B | Automotive | Energy | Services | Net cash | FSD | Robotaxi | Optimus | Total | Per share |
|---|---|---|---|---|---|---|---|---|---|
| Bear | 30 | 13 | 5 | 34 | 0 | 0 | 0 | 82 | $23 |
| Base | 53 | 38 | 9 | 34 | 69 | 122 | 16 | 342 | $97 |
| Bull | 76 | 64 | 15 | 34 | 207 | 1,571 | 164 | 2,131 | $540 |
| Market | 1,439 | $364.27 | |||||||
| The award's top tranche | 8,500 | $2,152 |
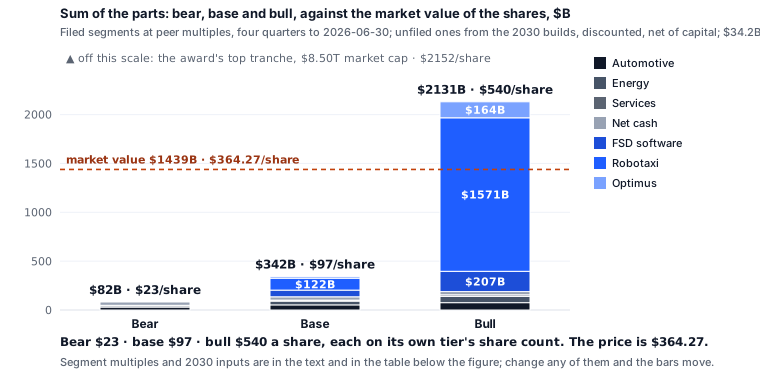
Read the table from left to right. The three filed businesses plus cash are $82 billion in the bear tier, $135 billion in the base and $189 billion in the bull: $23, $38 and $48 a share. Three tiers of multiples. The filed company never reaches $50 a share, and the bear tier is nothing but the filed company. The FSD software line adds nothing, $69 billion or $207 billion. Then the robotaxi line adds nothing, or $122 billion, or $1,571 billion, and the whole spread between the bear bar and the bull bar is in that one cell.
The market value of $1,439 billion sits between the base and the bull, 61% of the way up. On the base tier the price is 4.2 times the sum. On the bull tier, the tier that takes the company's timeline and milestones at their word and charges it for the cars, the sum is $2,131 billion and the price is a third below it. A buyer at $364 is paying for well over half of the bull case: the milestones met, a little late or a little short. The last row of the table is the ruler's top mark. The award's final tranche vests at a market capitalisation of $8.5 trillion, $2,152 a share, and that is the company's own statement of what complete success looks like. It is on the table so that the price has something above it to be measured against, whatever the price does next.
If a single number is wanted, weights are the reader's. At 25 / 50 / 25 across bear, base and bull the expected value is $724 billion, $189 a share. That figure moves by a quarter with a ten-point change in the bull weight, which is the reason the post prefers the three bars to any one of them.
Working backwards: which fleet is the market pricing?
Hold every part at its base value except one, and ask what size of robotaxi fleet in 2030 makes the sum equal to the price. The other parts at base come to $220 billion. The price is $1,439 billion. So the fleet has to be worth $1,219 billion today after paying for its cars, $1,785 billion in 2030.
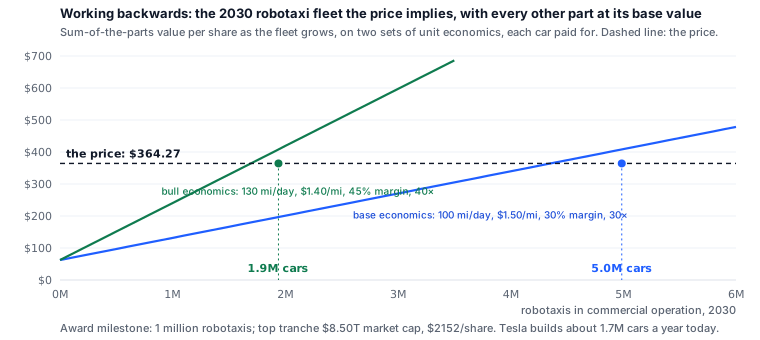
On the bull unit economics, each million cars is worth $957 billion in 2030, $629 billion today once the cars are paid for, and the price is reached at 1.9 million robotaxis in commercial operation. On the base economics, $394 billion a million in 2030, $244 billion today, and the price needs 5.0 million. The award's own milestone is 1 million. Tesla builds about 1.7 million cars a year today, all models. So the price is somewhere between "the milestone, nearly doubled, on the best unit economics anyone has proposed" and "the milestone times five". Both are statements about 2030 that a reader can hold a view on; neither is in any filing.
What each part has to deliver
The bull column, restated as the things that would have to be true, with the filed line that would show them.
- Cars: $76 billion. Only BYD's multiple on today's revenue. No growth required; this is the one part of the bull case that needs nothing to go right.
- FSD: 10 million subscriptions added at $1,800 a year. Verifiable when Tesla breaks the line out. Until then, the deferred-revenue footnote is the only trace of it.
- Robotaxi: 2.5 million cars earning $166 billion a year by 2030. From a few hundred cars in September 2026. The fleet number will appear in the quarterly update before it appears in revenue; the revenue will need a new line.
- Optimus: 1 million bots a year at $30,000. No product today. The milestone is the only public number.
- The cars paid for. The fleet is $75 billion of cars at $30,000 each, and the sum above has already charged the option for them. Free cash flow in the last four quarters was $5.8 billion; net cash is $34.2 billion. The money has to come from somewhere, and the filed lines that would show it are capex and the cash line.
Risks you can read off the filings
| Risk | The number | What to watch next quarter |
|---|---|---|
| Spending running ahead of gross profit | H1 capex $8.3B vs $3.9B; R&D +49% | Whether gross profit growth catches the two lines consuming it |
| Regulatory credits fading | $1.0B → $0.5B, H1 to H1 | The line reaching zero takes a tenth off automotive gross profit |
| Operating margin | 4.2% for the year, 1.4% in Q2 | Q3 operating income against $398M |
| Share count | 3,949.5M on the cover, 423.7M of it the award, against 3,237M in the EPS line | Each vesting tranche of the award; the diluted count in the EPS line |
| Stock compensation | $3.8B in the year, equal to net income | Whether it stays there as the award vests |
| Dependence on one person | The 10-K's own risk factor | No number; the filing says it in words |
On the share count: the cover count of 3,949.5 million includes the 423.7 million restricted shares of the 2025 CEO award, issued in twelve tranches that vest only on market-capitalisation milestones from $2 trillion to $8.5 trillion, each paired with an operational milestone; they are not in the earnings-per-share denominator of 3,237 million, and if the milestones are not met they are forfeited. So this post divides each tier by the shares that would exist in it: the bear and base tiers, in which no milestone is met, by 3,525.8 million; the bull tier, in which they are, by the full 3,949.5 million. The market value of $1,439 billion is the price on the full count, because that is how the market quotes it. The effect is what you would expect: the award takes nothing from the bear case, which is $23 rather than $21 a share on the full count, and it takes a piece of the bull case from the shareholders who financed it, which is what the award is for.
Method and sources
Every multiple is a judgement; the peer strips show where comparable companies trade, and the tiers are chosen from that range. The unfiled businesses are options because they have no revenue and no comparable, and the three tiers are three levels of faith with their inputs printed; an option pays for what it has to build and is never worth less than zero, and one that lives inside a filed line counts only for what it adds. The base tier discounts the company's stated timelines by the company's own record; the bull tier takes the company's stated milestones at face value. Net cash is cash and short-term investments less debt and finance leases at 2026-06-30, added once for the whole company; the carmaker peers are on price to sales, a multiple that already carries their own net cash, so on that one line a little of Tesla's cash is counted twice, and the post prefers that to an EV/sales that would carry the peers' finance-arm debt. The reverse-DCF page for TSLA asks the same question in one number instead of seven, and how to read a reverse DCF explains that number.
Segment revenue, gross profit, expenses, capital spending, the share count and the award's shares and milestones are from Tesla's 10-Q for the quarter ended 2026-06-30 and 10-K for 2025, read from the XBRL. Peer multiples and the close are FMP data on 2026-09-18. The Cybertruck, Semi and 2019 robotaxi dates are from Tesla's own announcements at the time. All of it is arithmetic on public numbers, laid out so that it can be redone with different ones.
The weekly
The week's 13F filings, insider trades and earnings, plus new research on the site. One email a week, no account.
More posts
- Anthropic's $16.8B quarter: the investor day numbers
- What is a DCF? What a corner shop is worth
- How the 10-year Treasury moves every valuation on this site
- Delta vs United by the numbers
- Anthropic's IPO prospectus: the numbers behind the $42B loss
- Who actually owns this stock: how to read a 13F
- How to read a market sentiment gauge
- Market breadth: the index can rise while most stocks fall
- How we value a stock: twelve models, one number
- Where the numbers come from: filings, point in time
- How to read a reverse DCF: the growth a stock price implies
- How to value a bank: P/TBV, ROTCE and the line
- How to value a REIT: FFO, P/FFO and the yield spread
- How to value a software company: Rule of 40 and SBC
- Total return vs price return: what a stock chart leaves out
- What a backtest cannot tell you