Why Goldman, Citi, J&J and ASML stocks fell after earnings
 Allen Yan · · 9 min read
Contents
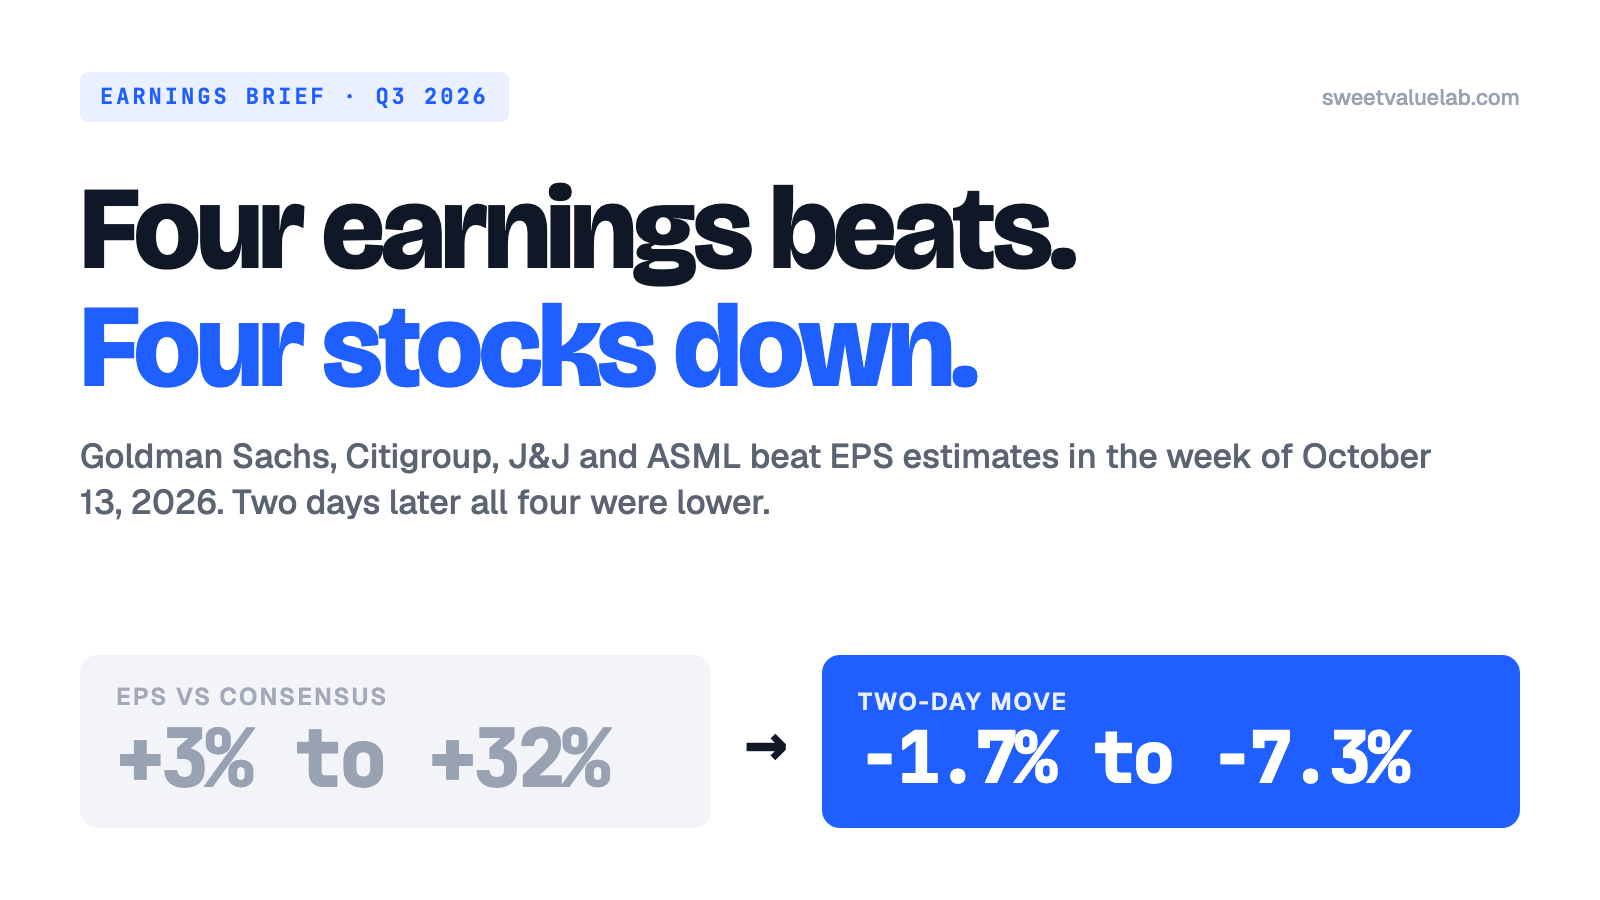
Third-quarter earnings season opened in the week of October 13, 2026. Of the 27 large companies on this site that reported that week, 25 beat analysts' earnings-per-share estimates. Sixteen of those 25 were lower two days later.
Four of them make the pattern easy to see: Goldman Sachs, Citigroup, Johnson & Johnson and ASML. Each beat, by 3% to 32%. Each fell, by 1.7% to 7.3%. Below I go through each report against two baselines, a year ago and the quarter before, using the companies' own filings, and then put the four side by side. Why a beat and a falling stock go together so often has its own explainer.
Today at a glance:
- Goldman Sachs: EPS $17.01 against $12.86 expected, but down 19% from the second quarter.
- Citigroup: best third-quarter revenue in a decade, with trading guided down about 20% for the fourth.
- Johnson & Johnson: a beat against a guide it had cut by $0.64 in July. MedTech missed.
- ASML: sales up 55% from a year ago and about €60 million short of the forecast.
The big picture: a beat is a comparison with one forecast
A beat means the reported number came in above the consensus, the average of the analysts' estimates collected by a data vendor. Vendors collect different panels, so the consensus is not one number. For Goldman's EPS, FMP had $12.86 and LSEG had $13.02. This post uses FMP's figures throughout and names the other where a report quoted it.
The chart below puts every large reporter of the week on one plane: how far EPS came in above or below its consensus, and where the stock closed the day after the report.
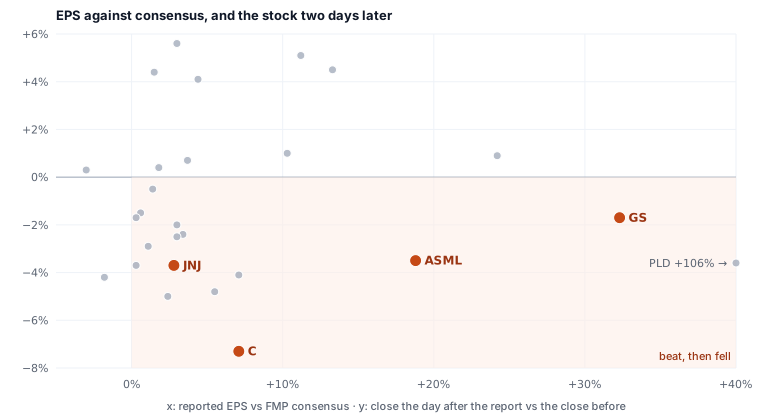
The size of the beat explains little of the move. Goldman's 32% beat and Citi's 7% beat both fell; BlackRock beat by 11% and rose 5.1%. Aswath Damodaran made the same point about the second quarter of 2026 in a post on the earnings game, where a large share of positive surprises came with price drops.
The week had its own weather too. September's consumer prices, published on October 14, rose 3.7% from a year earlier against 3.6% expected, and rate-hike worries came back with them (XTB).
Goldman Sachs: why the stock fell 1.7% after a 32% EPS beat
Source: Goldman Sachs third-quarter 2026 earnings release (8-K exhibit, 2026-10-13).
- Net revenue +23% Y/Y to $18.68 billion (−8% Q/Q).
- Diluted EPS $17.01, +39% Y/Y, against $12.86 at FMP and $13.02 at LSEG. In the second quarter it was $20.98, so −19% Q/Q.
- Equities +72% Y/Y to $6.44 billion (−13% Q/Q).
- FICC $3.47 billion: −0.6% Y/Y, −24% Q/Q.
- Investment banking fees +21% Y/Y to $3.22 billion (−5% Q/Q).
- CET1 12.4%, from 12.9% at the end of June. Buybacks were $3.0 billion, at an average of $1,048.73 a share.
Key developments:
- The comparison that mattered was the second quarter. Against a year ago, almost every line grew. Against the record second quarter, EPS fell 19% and fixed income 24%. CEO David Solomon described May and June on the call as "a top, top decile environment" and the present as "a top quartile environment" (call transcript).
- The CEO had warned a month earlier. At a Barclays conference on September 16, Solomon flagged softer fixed-income trading and higher costs for the quarter (Yahoo Finance). The stock fell 4.0% that day, from $976.67 to $937.98.
- Some of the $17.01 will not repeat. A tax benefit on share-based awards added about $3.20 to EPS over the first nine months of the year, according to the release.
- Takeaway: the shares opened 3.2% higher on October 13 and closed 0.2% lower. The firm bought back stock at $1,048.73 on average during the quarter; it closed the week at $881.26.
Citigroup: why the stock fell 7.3% after a 7% EPS beat
Source: Citigroup third-quarter 2026 earnings release (8-K exhibit, 2026-10-13).
- Revenue +8% Y/Y to $23.85 billion (−4% Q/Q from $24.77 billion).
- Diluted EPS $2.85 against $2.66 at FMP. A year ago it was $1.86, or $2.24 without that quarter's $726 million Banamex goodwill impairment: +27% like for like.
- Markets +6% Y/Y to $6.11 billion, −13% Q/Q. Equities fell to $1.73 billion from $2.30 billion in the second quarter.
- Investment banking $1.35 billion: +9% Y/Y, −13% Q/Q.
- Services +15% Y/Y to $6.61 billion. Wealth +15% to $3.27 billion.
- ROTCE 11.5%, from 13.0% in the second quarter. Credit-loss provisions were $2.59 billion, including a $369 million reserve build.
Key developments:
- The stock ran up into the report. It gained 3.1% on October 12 to $131.93, its highest close of the month. By the October 14 close it was $122.27.
- Trading was guided lower. Citi's chief financial officer said on the call that fourth-quarter Markets revenue would be down about 20% from the third, "possibly a bit more" (transcript, Investing.com). On $6.11 billion, 20% is about $1.2 billion of revenue.
- The steady businesses grew; the market-sensitive ones shrank. Services and Wealth, the two the restructuring is built around, each grew 15% from a year ago. Trading and investment banking each fell 13% from the second quarter.
- Takeaway: a better quarter than a year ago and a weaker one than the last, with the next one guided weaker still.
CEO Jane Fraser in the release:
"We expect to exceed this year's return target, even as we pull forward investments toward our 11-13% near-term goal"
Johnson & Johnson: why the stock fell 3.7% after a 3% EPS beat
Source: J&J third-quarter 2026 earnings release and sales supplement (8-K exhibits, 2026-10-13).
- Sales +5.9% Y/Y to $25.40 billion (+0.4% Q/Q). U.S. +9.1%, international +1.5%.
- Adjusted EPS $2.59 against $2.52 at FMP and $2.54 at LSEG. It was $2.80 a year ago (−7.5%) and $2.90 in the second quarter (−11%).
- Reported EPS $0.09, after a special charge for the proposed talc settlement, which the company put at $5.5 billion on the call.
- Innovative Medicine +7.7% to $16.76 billion. Tremfya +68% to $2.40 billion; Darzalex +15% to $4.24 billion; Stelara −54% to $716 million as biosimilars take its sales.
- MedTech +2.5% to $8.64 billion. U.S. +4.8%, international +0.1%.
- 2026 guidance: adjusted EPS $11.05–$11.15, up $0.06 from the range set on July 29.
Key developments:
- The beat was against a lowered bar. On July 15 J&J guided 2026 adjusted EPS to $11.60–$11.75. On July 29 it cut that by $0.64 for the cost of buying Firefly Bio and Sail Biomedicines (8-K, 2026-07-29). Adjusted EPS fell 7.5% from a year ago and still came in above the estimates.
- MedTech missed for a second quarter. Its $8.64 billion was under LSEG's $8.71 billion, with sales outside the U.S. flat (Reuters via CNBC). Darzalex, the largest drug, came in at $4.24 billion against about $4.4 billion expected.
- The drugs replacing Stelara are growing fast. Tremfya, Caplyta, Tecvayli and Rybrevant each grew more than 60%. Stelara lost $854 million of quarterly sales in a year; Tremfya alone added $972 million.
- Takeaway: the stock opened 3.5% lower and closed down 5.7% on the day, then won back part of it on October 14.
CEO Joaquin Duato on the call (transcript):
"We have proved our ability to grow through a significant loss of exclusivity."
ASML: why the stock fell 3.5% after a 19% EPS beat
Source: ASML third-quarter 2026 press release (6-K, 2026-10-14). ASML reports in euros; its US shares trade on Nasdaq.
- Net sales +55% Y/Y to €11.66 billion (+25% Q/Q), against about €11.72 billion expected (TIKR via Yahoo Finance).
- Gross margin 57.5%, from 54.0% in the second quarter and 51.6% a year ago. ASML had guided 55–57%.
- Net income €4.96 billion; diluted EPS €12.93 (€5.48 a year ago). Per US share, $14.47 against $12.18 at FMP.
- China was 23% of system sales, from 42% a year earlier.
- Guidance: fourth-quarter sales €14.2–15.2 billion at a gross margin of about 57%; full year €44–45 billion, from €43–45 billion in July.
- Capital return: about €4.1 billion of buybacks in the quarter; an interim dividend of €1.88.
Key developments:
-
About €1.33 a share came from one investment. The quarter included a €509.7 million pre-tax gain on equity investments, which the CFO tied mostly to revaluing the stake in Mistral AI (call transcript). Over 384 million diluted shares, that is about €1.33 of the €12.93 before tax.
-
Sales were a hair under the forecast. €11.66 billion against €11.72 billion is about €60 million, or 0.5%. The EPS beat came from the margin and the investment gain.
-
ASML says it cannot build enough. CEO Christophe Fouquet in the release:
"we now expect that our supply as currently planned for both 2027 and 2028 will not fully meet the demand of our customers"
-
Chip stocks fell with it. On October 14, the day of the inflation print, Nvidia closed down 3.16% and Micron 4.10% (TradingKey).
-
Takeaway: record sales, margin above its own guide, and a stock that fell 3.9% on the day.
What the four had in common: the quarter before and the guide
On the day itself, two patterns show up. Goldman and Citi opened flat or higher and sold off through the session. J&J and ASML opened lower and kept going.
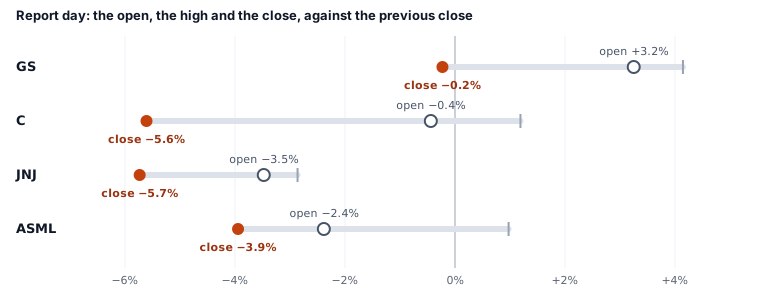
Each of the four beat its consensus, and each had one number that went the other way:
| Company | EPS vs consensus (FMP) | The number that went the other way |
|---|---|---|
| Goldman Sachs | +32% | EPS −19% from the second quarter |
| Citigroup | +7% | Q4 Markets guided ~−20% |
| Johnson & Johnson | +3% | MedTech below consensus, second quarter in a row |
| ASML | +19% | Sales 0.5% short; ~€1.33 a share from one gain |
Where each closed the week against this site's models, on the October 16 close:
| Company | Close | Model value | Model | Price vs model |
|---|---|---|---|---|
| Goldman Sachs | $881.26 | $885.15 | Peers' P/E | undervalued by 0.4% vs model |
| Citigroup | $124.26 | $115.25 | Price to tangible book | overvalued by 7.8% vs model |
| Johnson & Johnson | $255.56 | $230.49 | DCF, 5 years | overvalued by 10.9% vs model |
| ASML | $1,641.52 | n/a | n/a | not valued: reports in euros |
The model values are the ones the stock pages showed on October 19, 2026. Whether the second quarter was the peak for Goldman's and Citi's trading desks is the question the fourth quarter answers. The next reports are on the earnings calendar; the checklist for reading them is in Why do stocks fall after beating earnings?
Sources and data
- Goldman Sachs, Q3 2026 earnings release, 2026-10-13; call transcript, 2026-10-13.
- Citigroup, Q3 2026 earnings release, 2026-10-13; call transcript (Investing.com), 2026-10-13.
- Johnson & Johnson, Q3 2026 earnings release and sales supplement, 2026-10-13; guidance 8-K, 2026-07-29; call transcript, 2026-10-13.
- ASML, Q3 2026 press release, 2026-10-14; call transcript, 2026-10-14.
- Market reaction: Reuters via CNBC on J&J, 2026-10-13; Yahoo Finance on Goldman's September warning, 2026-09-16; TIKR via Yahoo Finance on ASML, 2026-10-15; TradingKey, 2026-10-14; XTB on the September CPI, 2026-10-14.
- Consensus EPS: FMP's earnings calendar, read 2026-10-19. Prices: daily closes on this site's stock pages, through 2026-10-16.
The weekly
The week's 13F filings, insider trades and earnings, plus new research on the site. One email a week, no account.
More posts
- Alphabet Q3 2026: Cloud +103%, free cash flow −$9.1B
- GE Vernova Q3 2026: $29B of orders, paid for in advance
- SoFi Q3 2026: revenue +44%, a $0.90 EPS outlook for 2027
- Coca-Cola Q3 2026: volume +5%, EPS guidance raised to 11%
- Anthropic's S-1: a $974 million operating profit in Q2 2026
- Tesla–SpaceX merger: the exchange ratio, valued part by part
- SpaceX Q3 2026: revenue +161%, the valuation moves $2
- Why do stocks fall after beating earnings?
- Anthropic's $16.8B quarter: the investor day numbers
- What is a DCF? What a corner shop is worth
- How the 10-year Treasury moves every valuation on this site
- Delta vs United by the numbers
- Anthropic's IPO prospectus: the numbers behind the $42B loss
- Who actually owns this stock: how to read a 13F
- How to read a market sentiment gauge
- Market breadth: the index can rise while most stocks fall
- How we value a stock: twelve models, one number
- Where the numbers come from: filings, point in time
- Tesla, taken apart: a sum of the parts in three scenarios
- How to read a reverse DCF: the growth a stock price implies
- How to value a bank: P/TBV, ROTCE and the line
- How to value a REIT: FFO, P/FFO and the yield spread
- How to value a software company: Rule of 40 and SBC
- Total return vs price return: what a stock chart leaves out
- What a backtest cannot tell you